Background
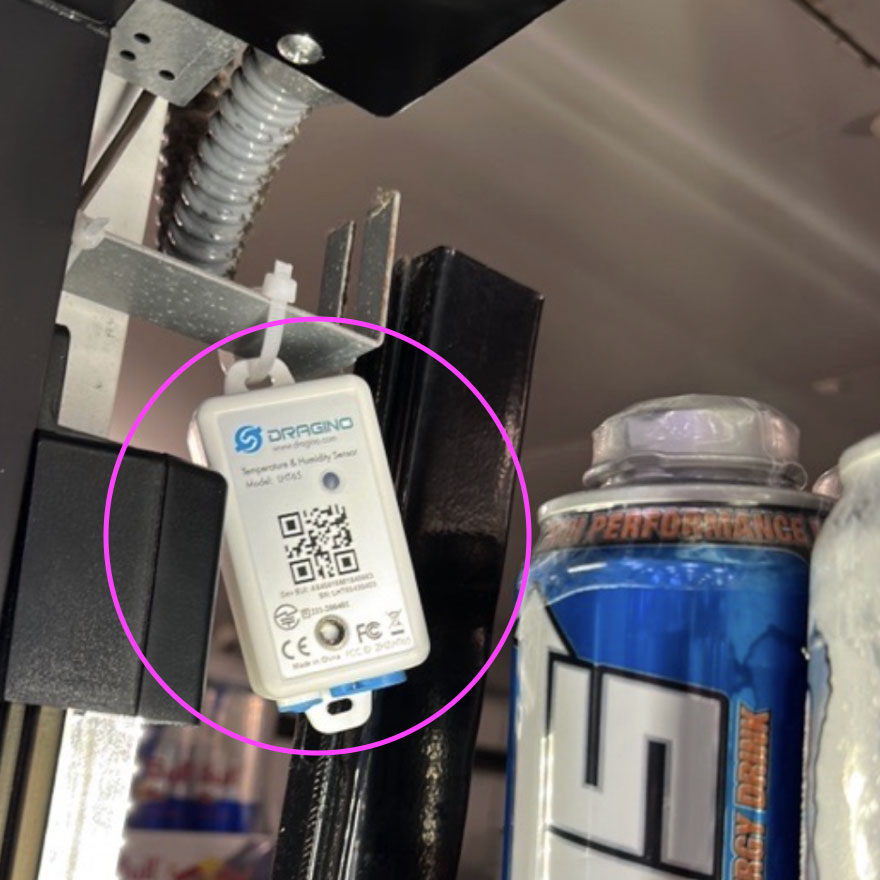
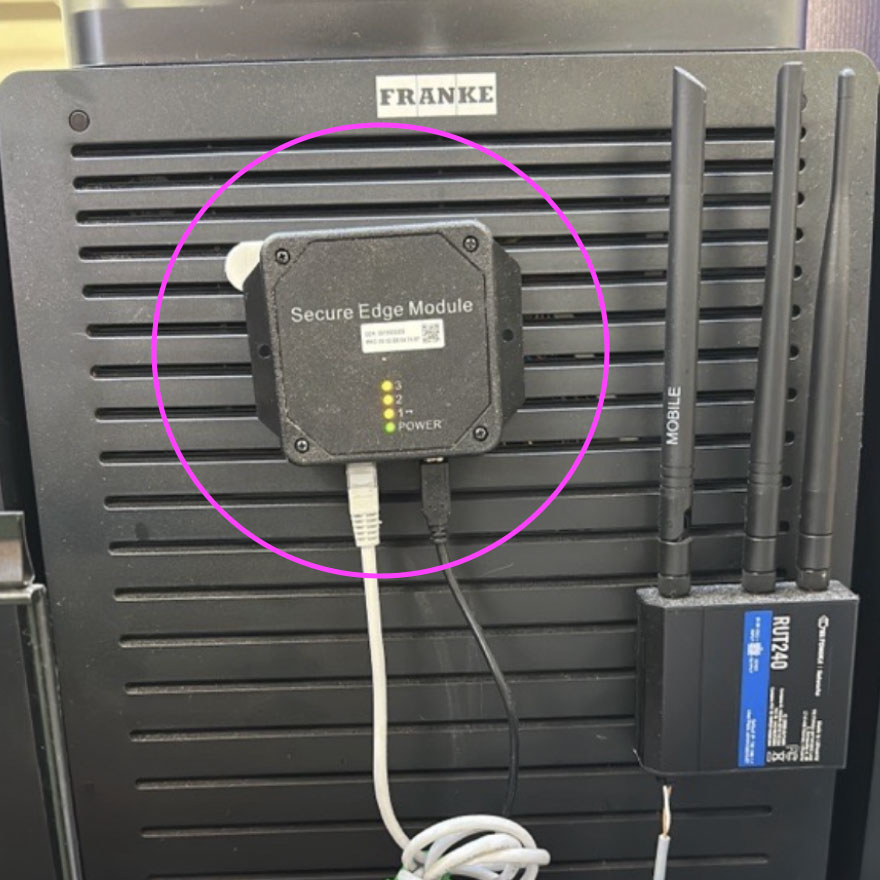
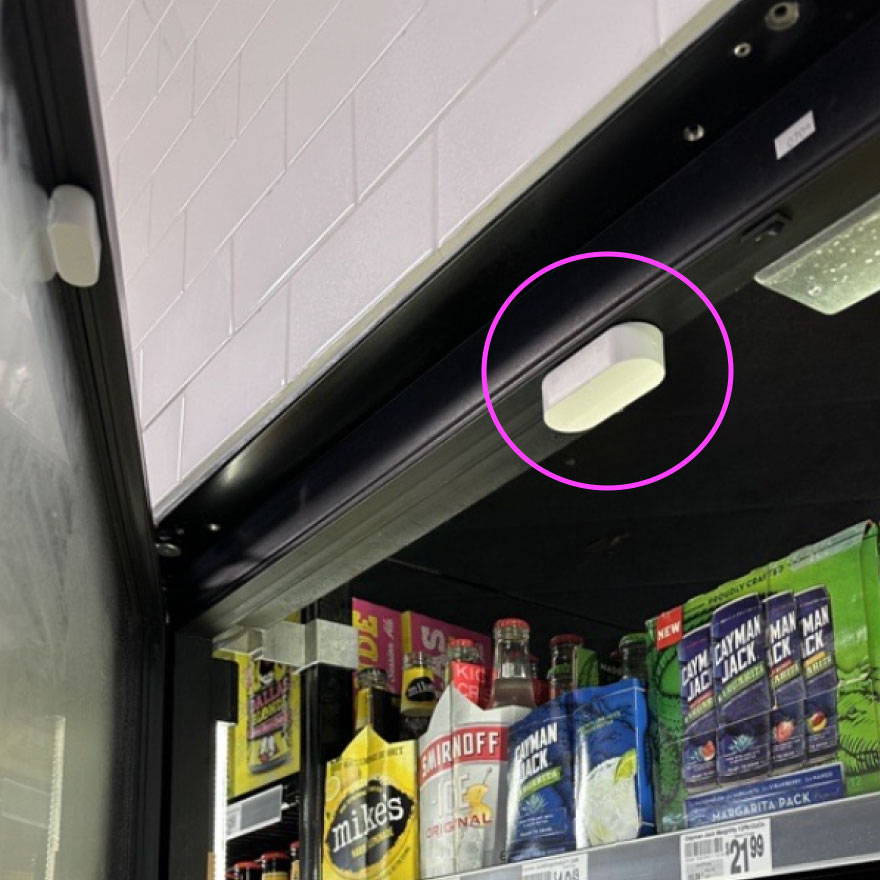
We’re building a “smart” store by adding sensors to equipment in order to collect actionable insights.
Over the past two years, I have been leading user experience efforts to research, design and test the "smart" store web product and app for 7-Eleven. This product receives information from a series of connected sensors across 50 pilot stores in the US.
Research
When the project began, it was a funded business idea. As a new team member, I worked with the product manager to identify three key factors:
- Who are the users?
- What data is most important to them?
- What actions can be taken from this data that helps them reach their goals?
We identified around twelve individuals with diverse roles in the company, including store associates, managers, directors, operations personnel, and in-house maintenance staff. To understand what was most important to each of them, I conducted phone interviews. Based on their feedback, we developed personas.
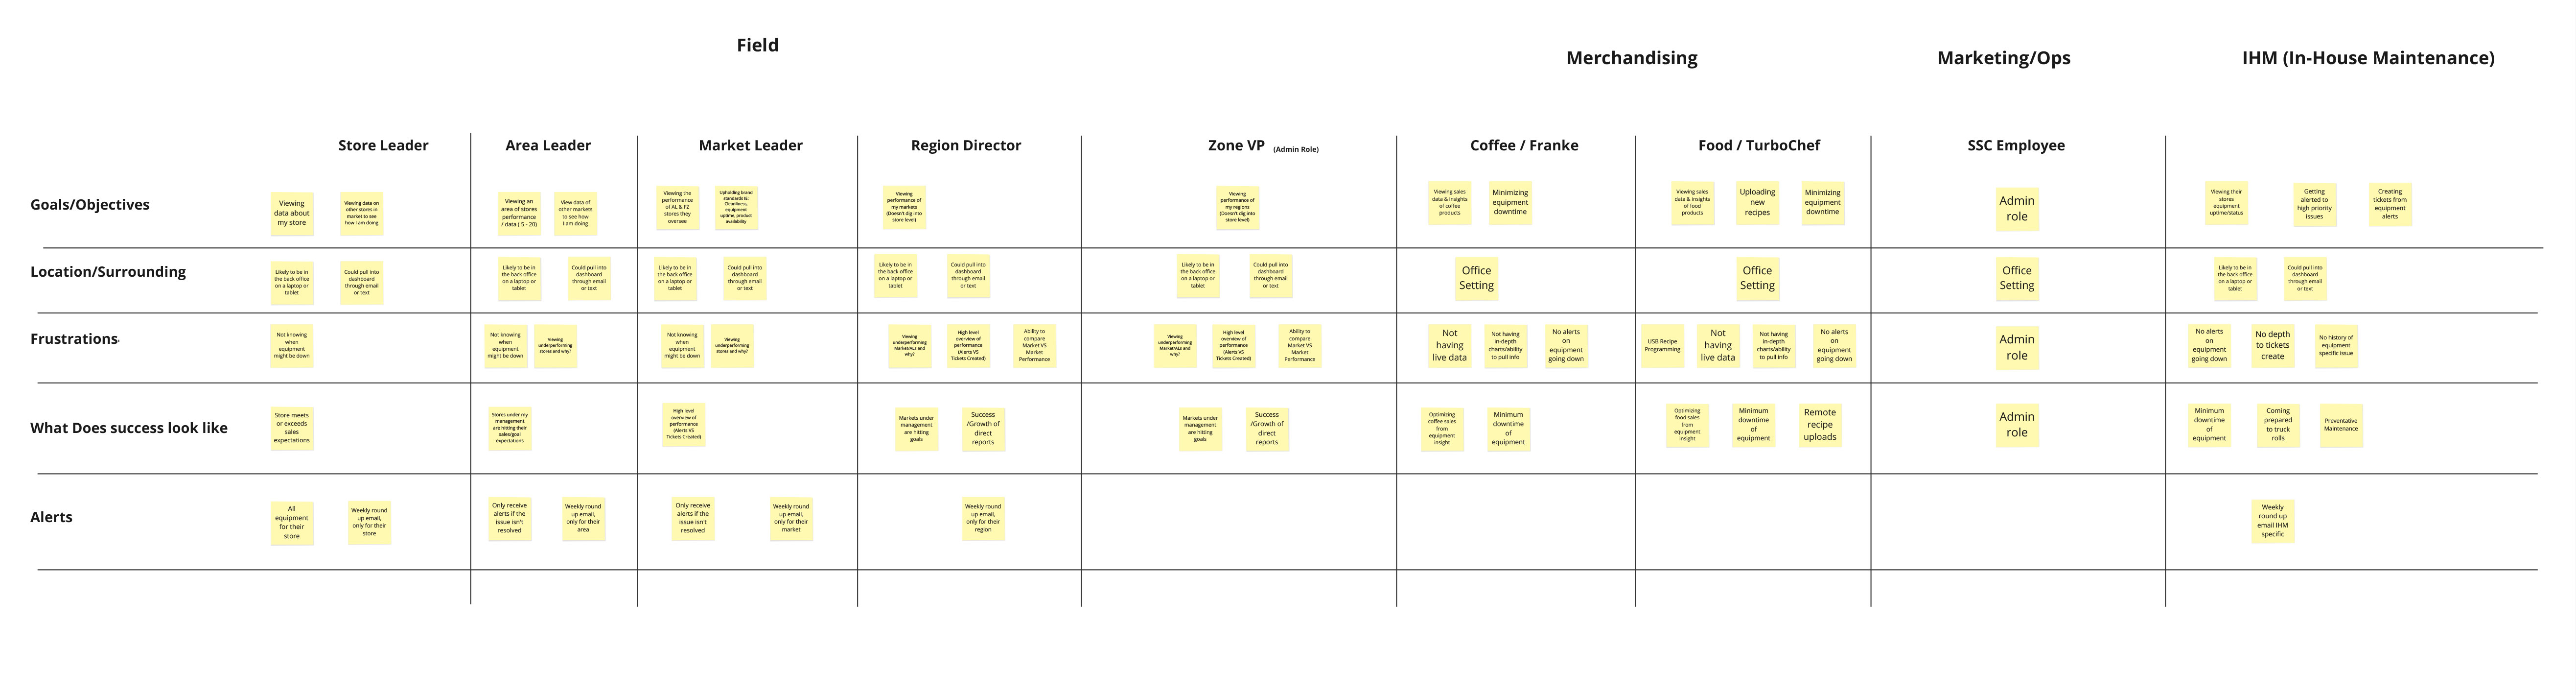
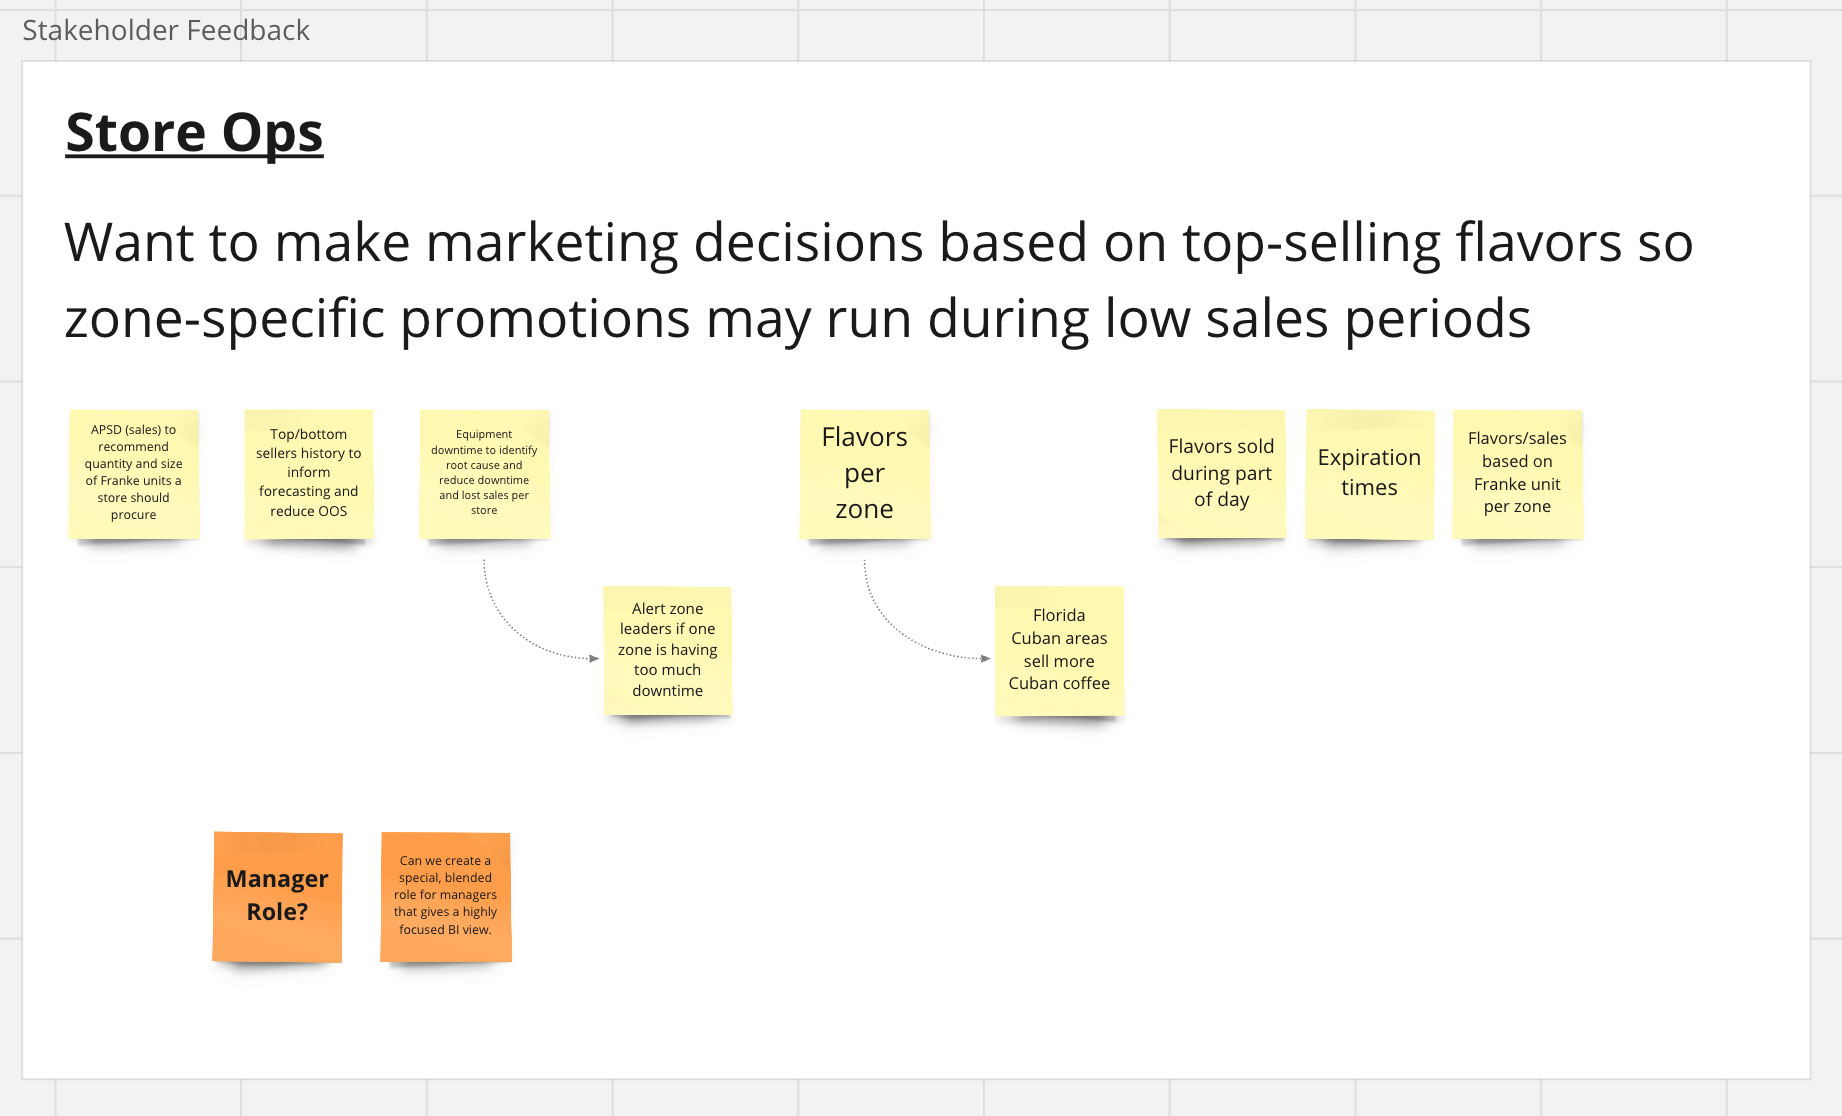
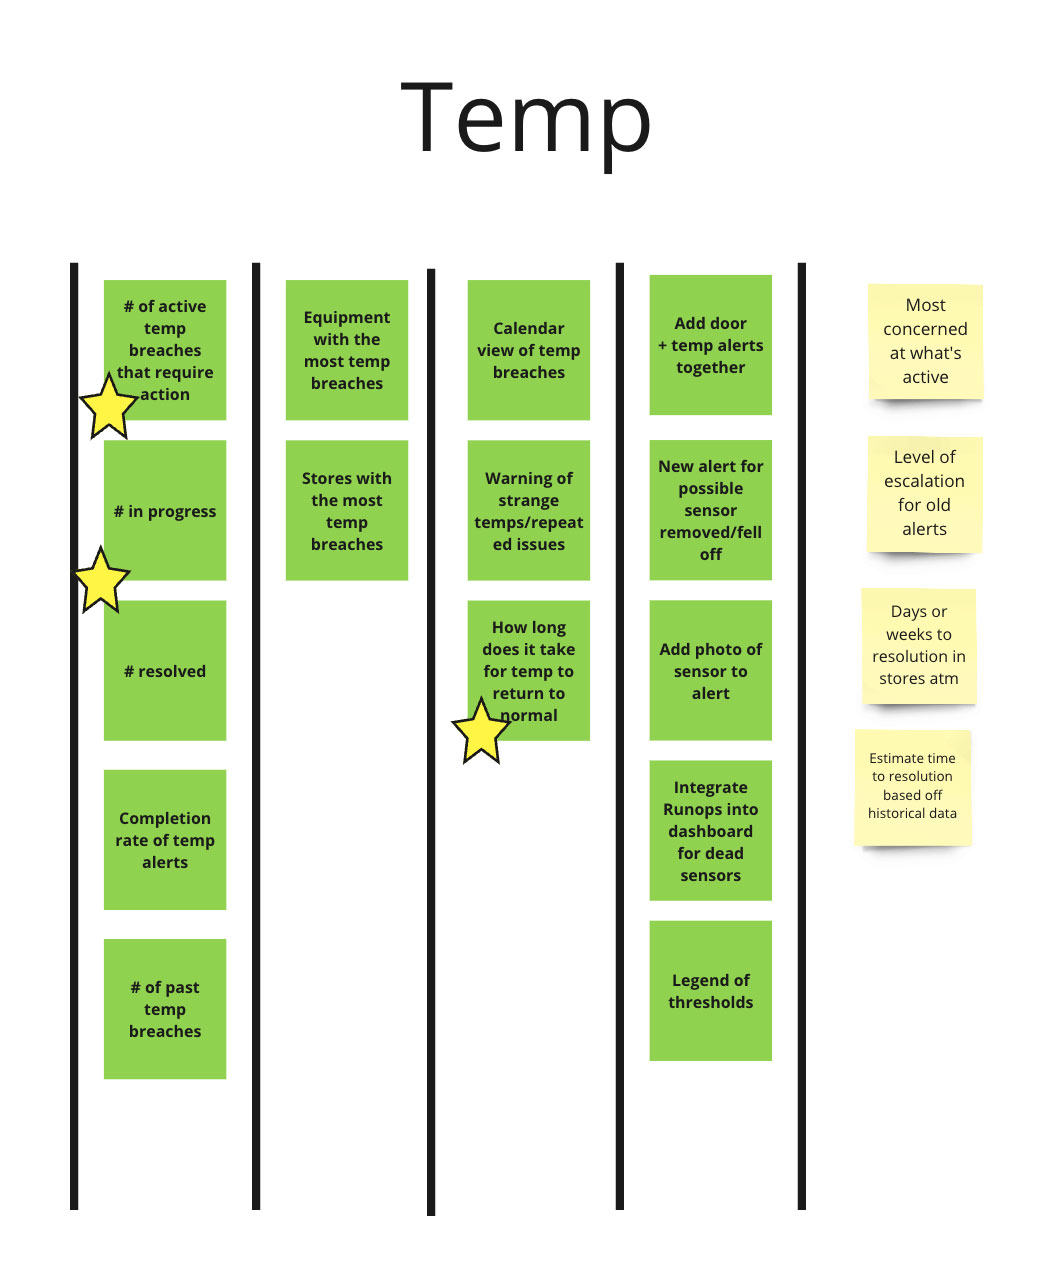
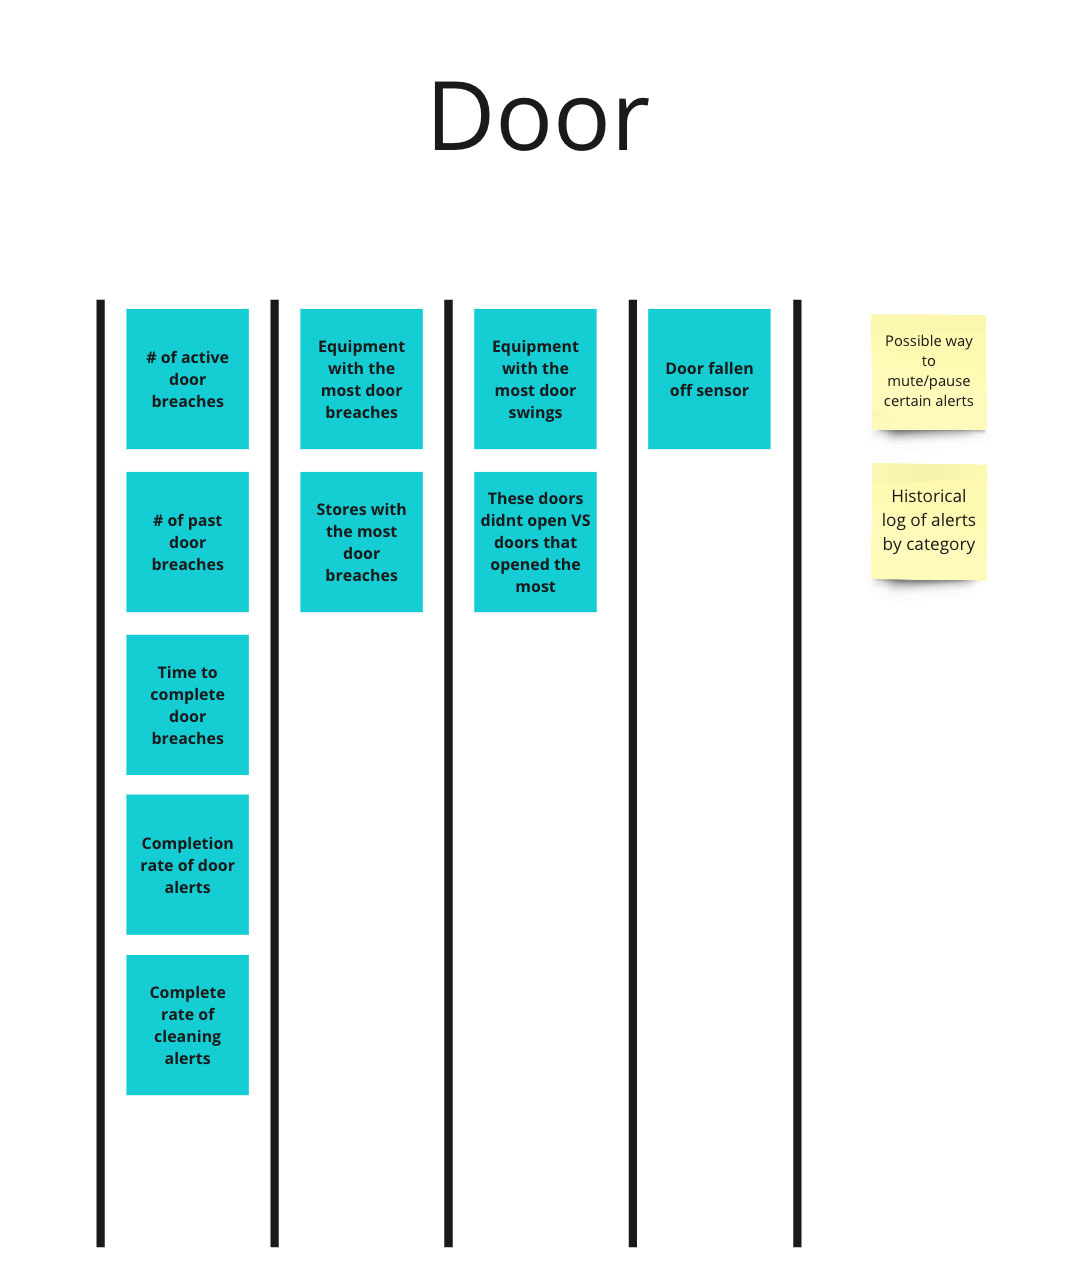
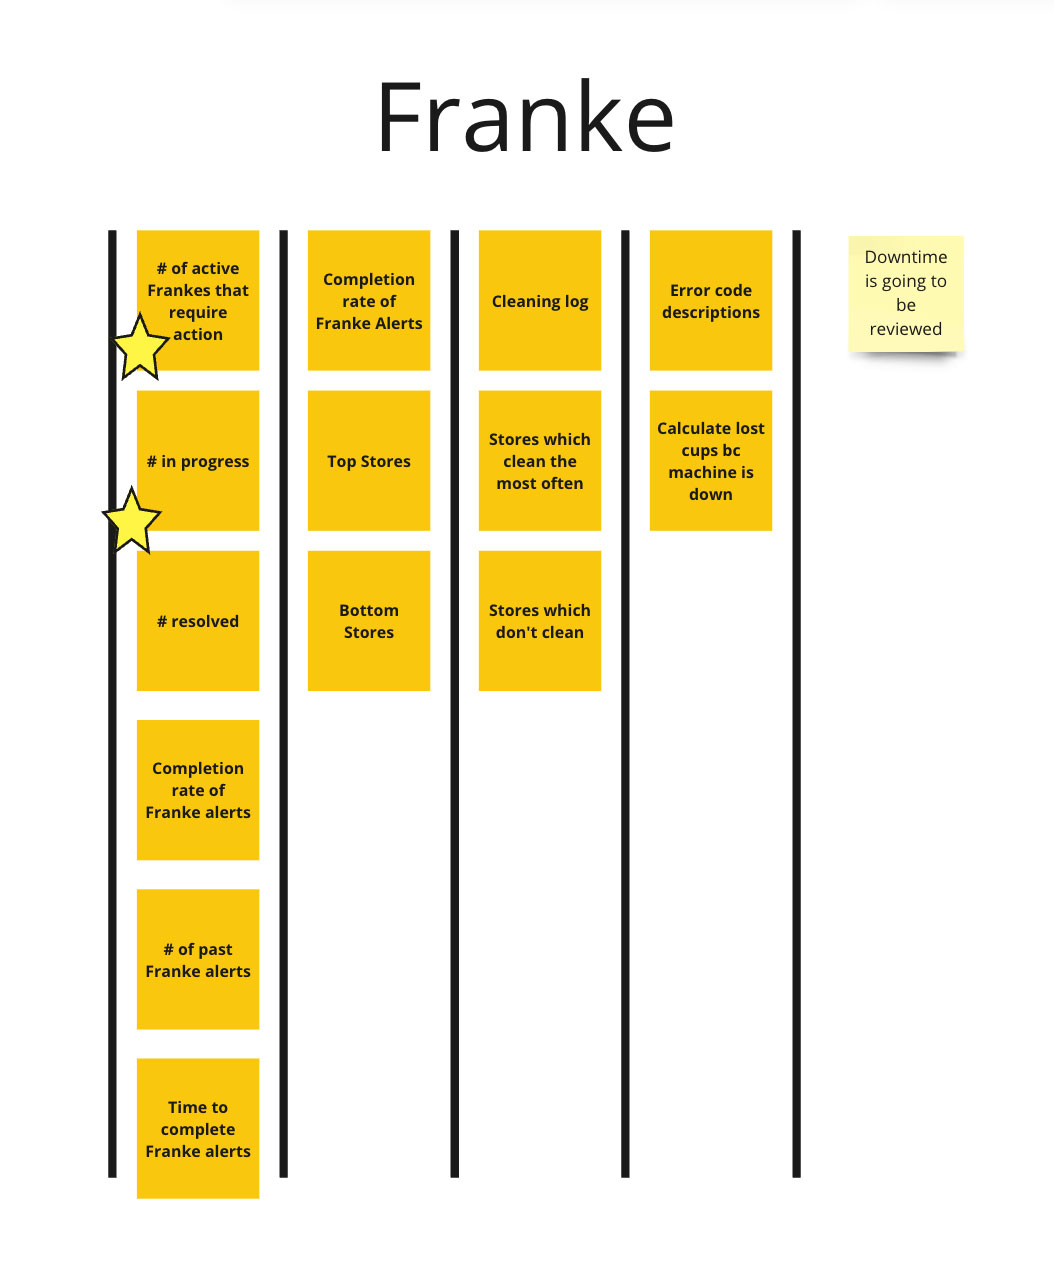
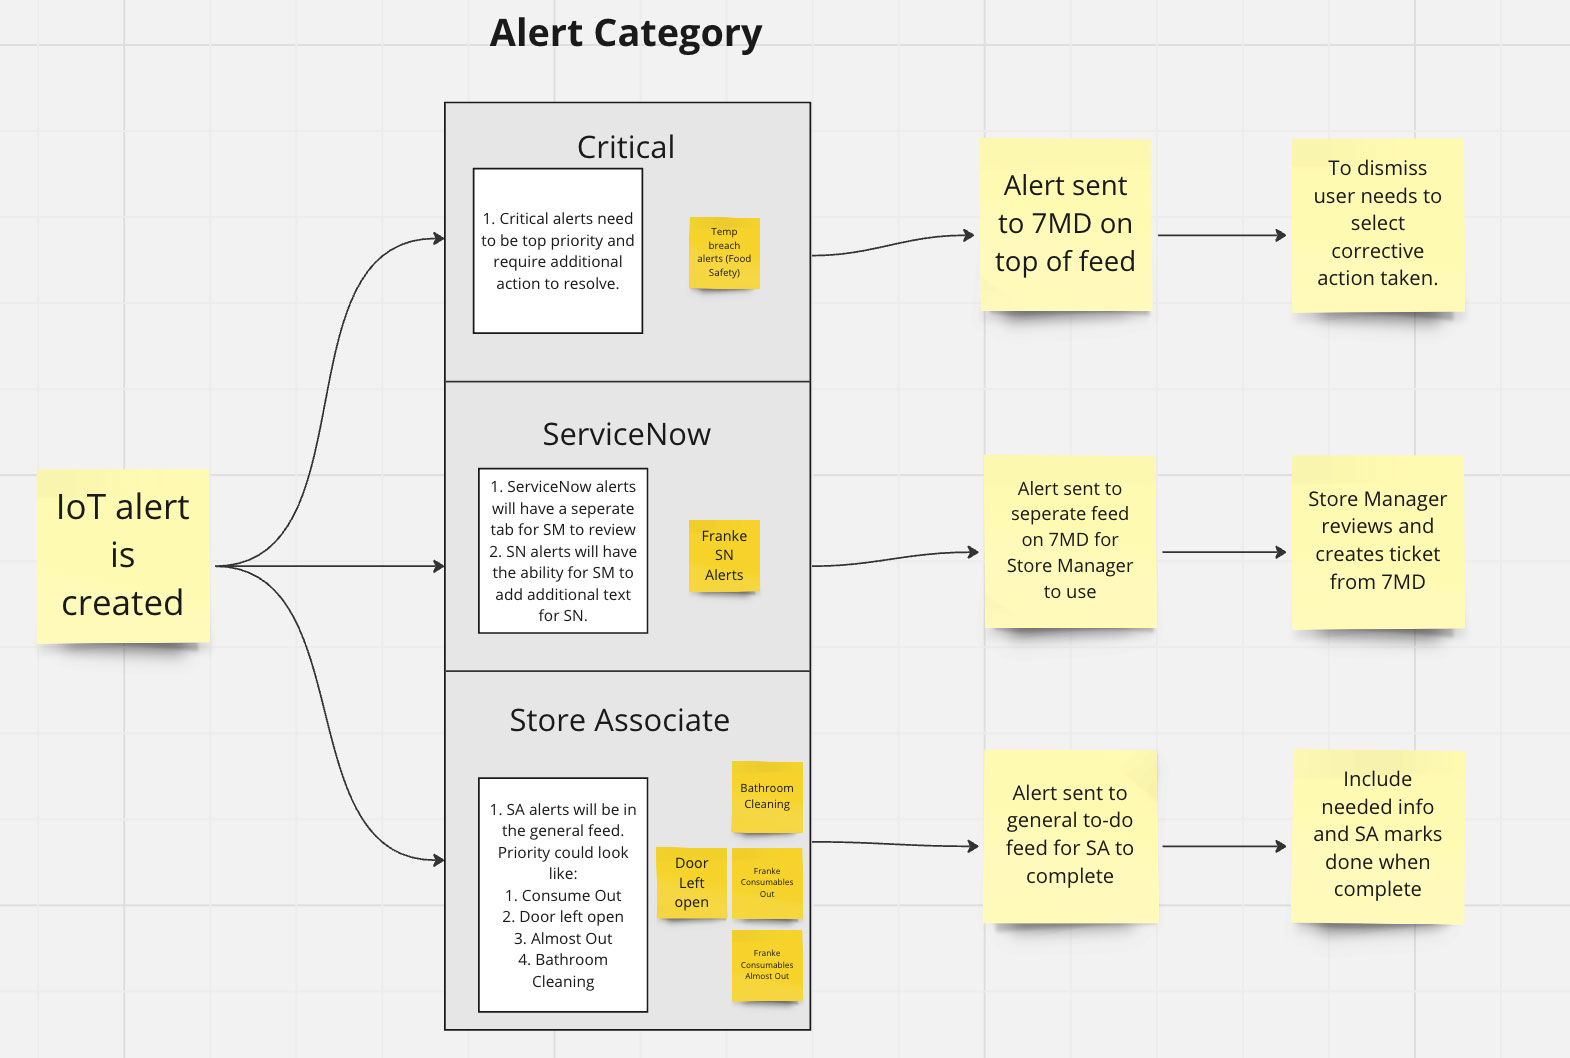
Some key actions were uncovered by each group that were important to their line of business. Here are just a few examples.
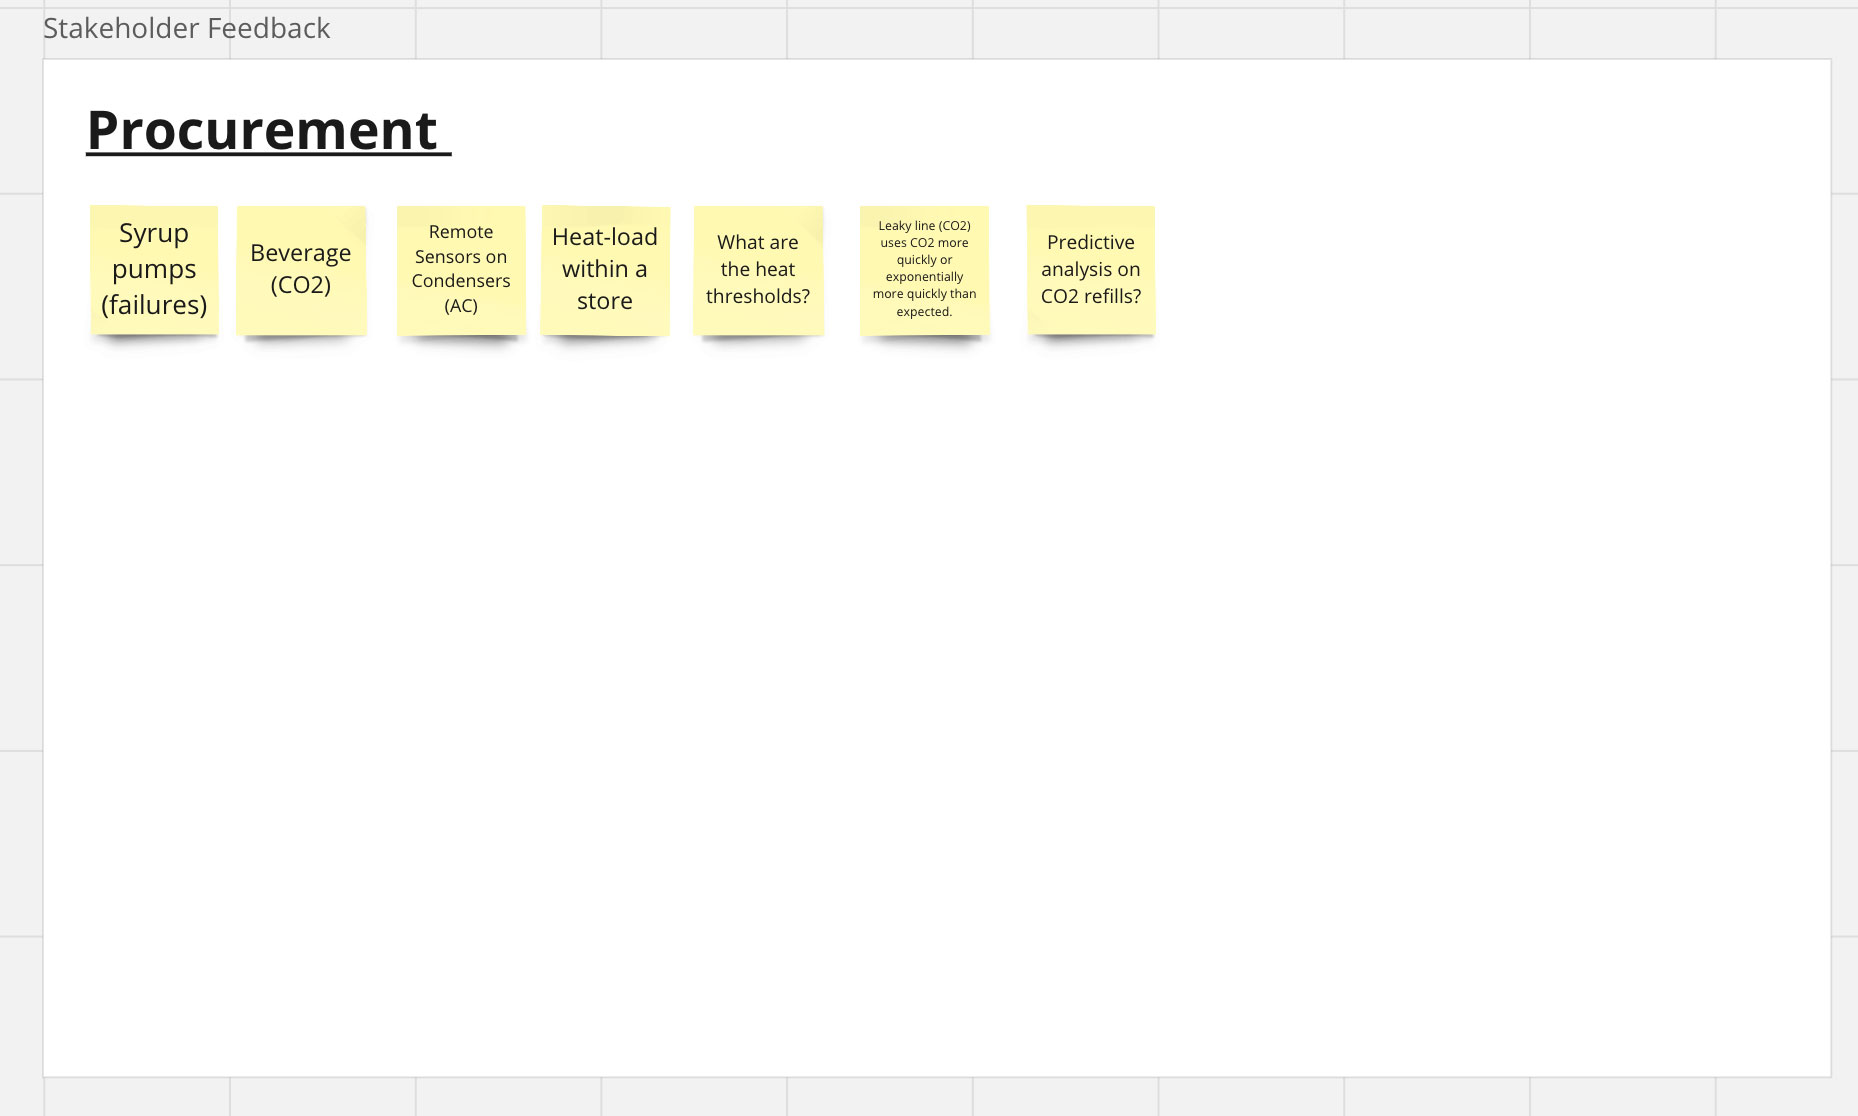
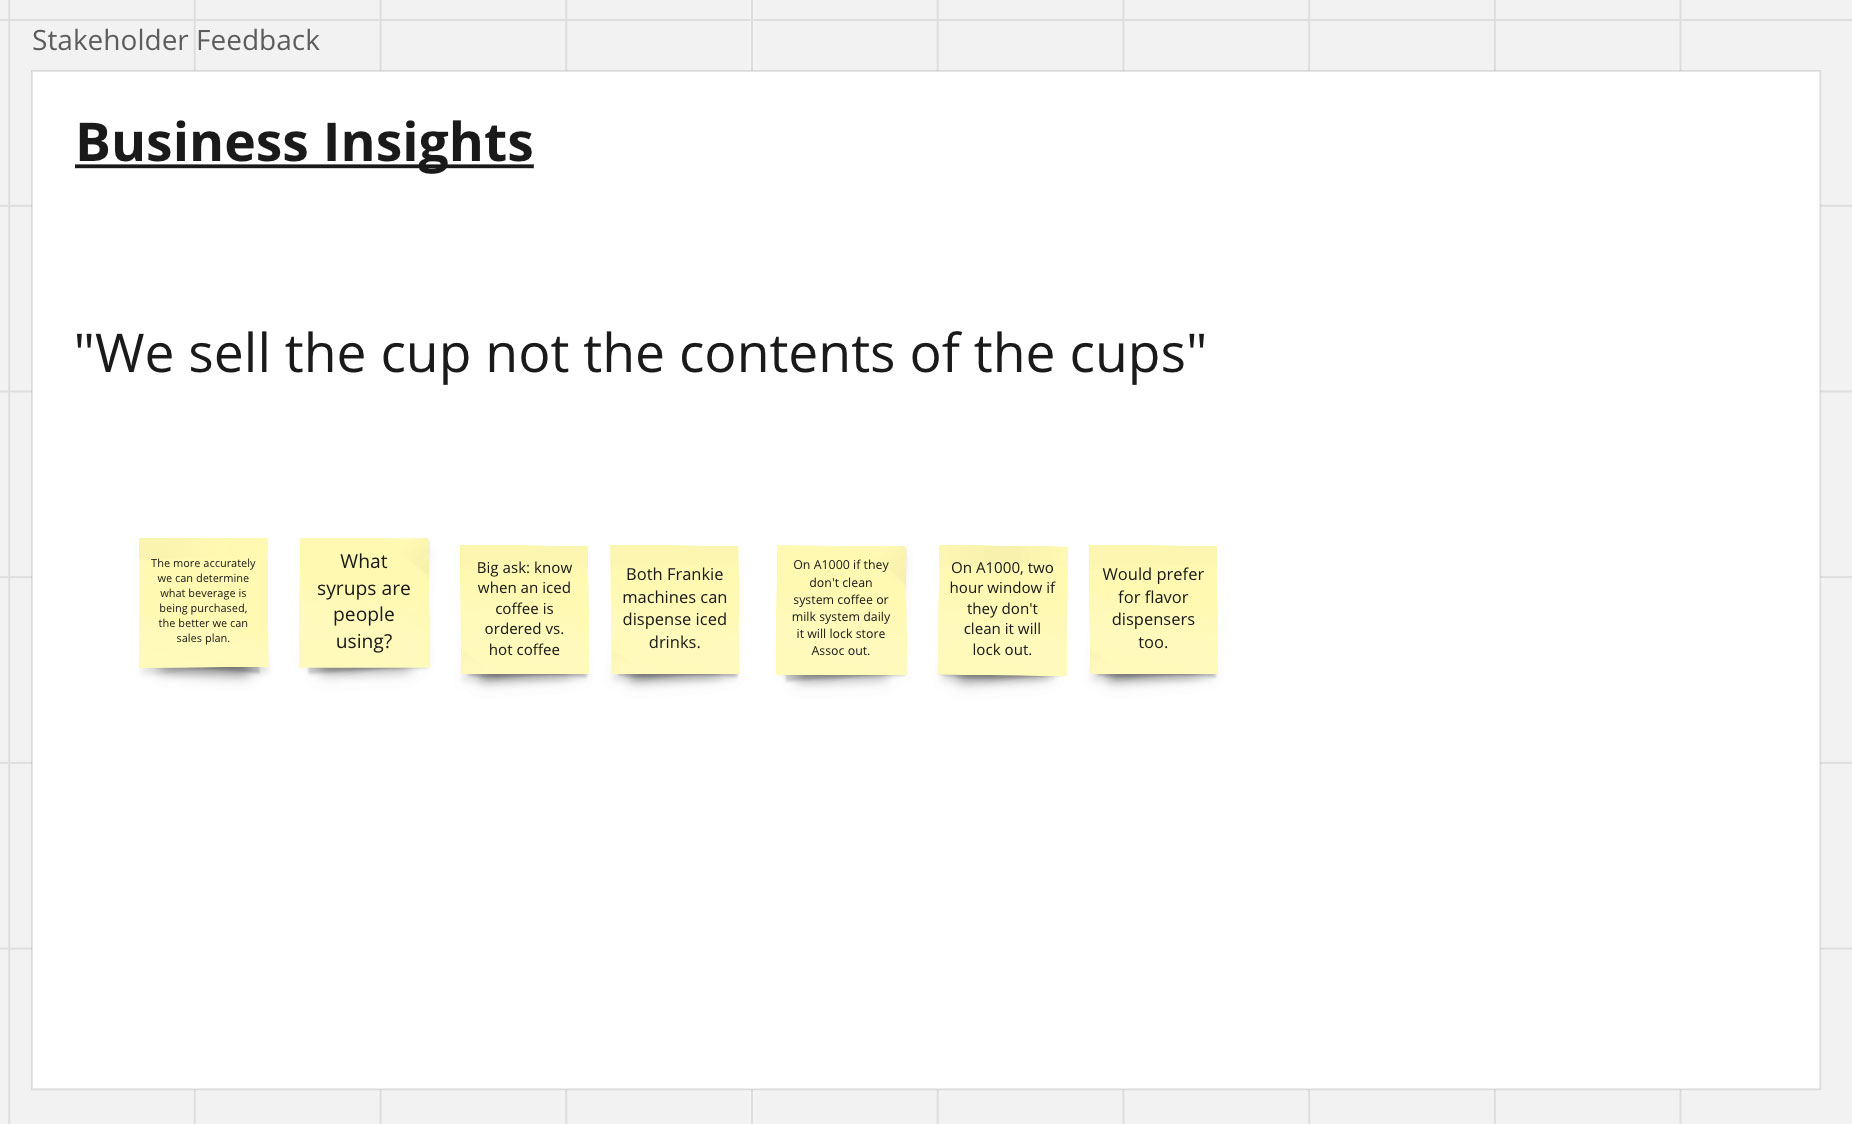
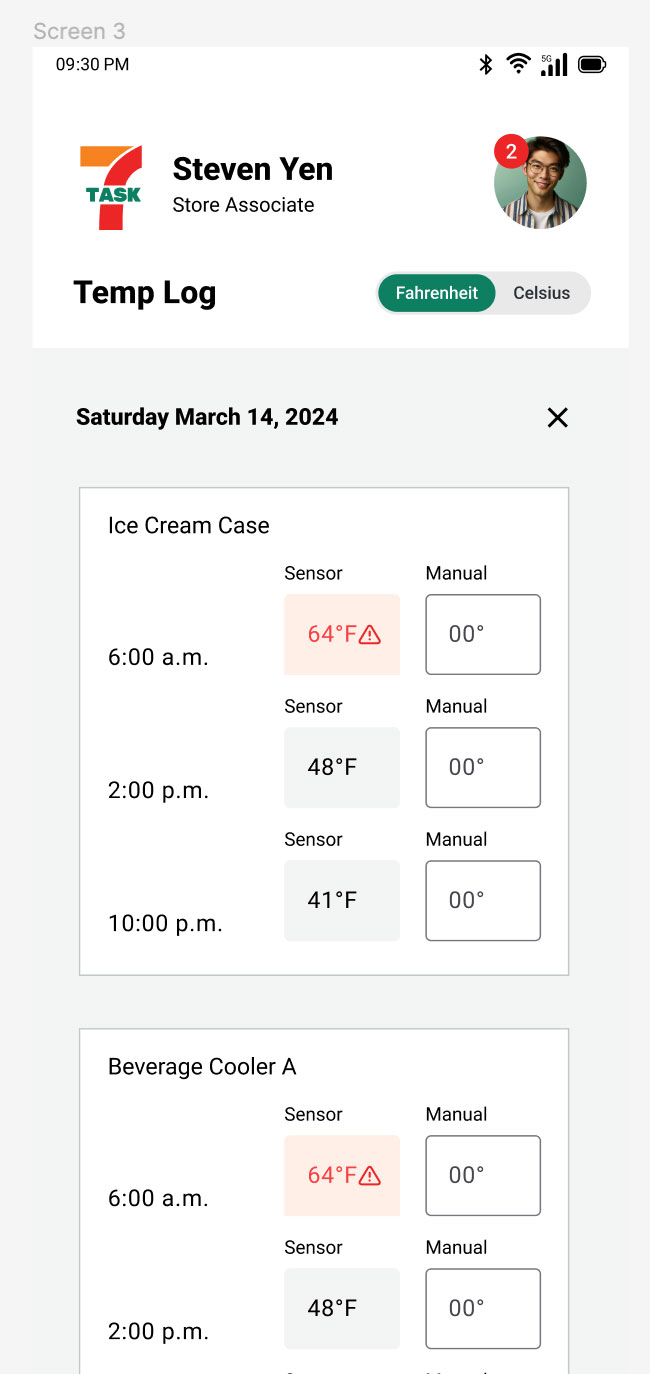
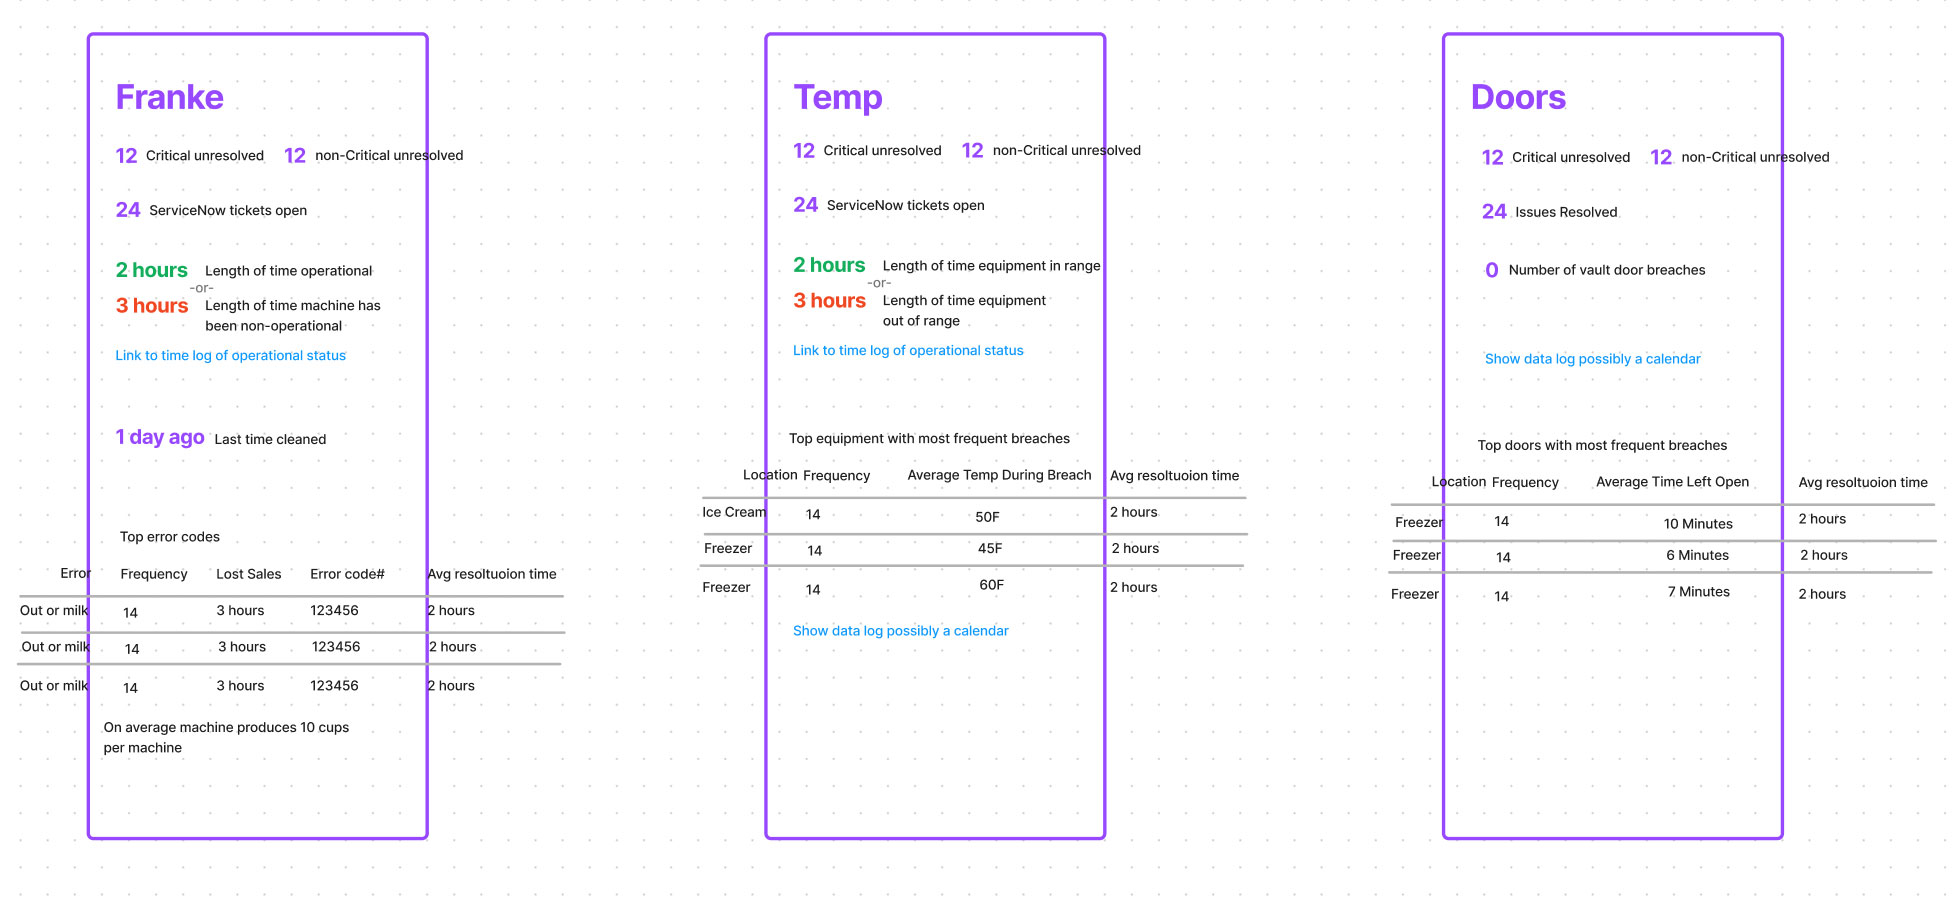
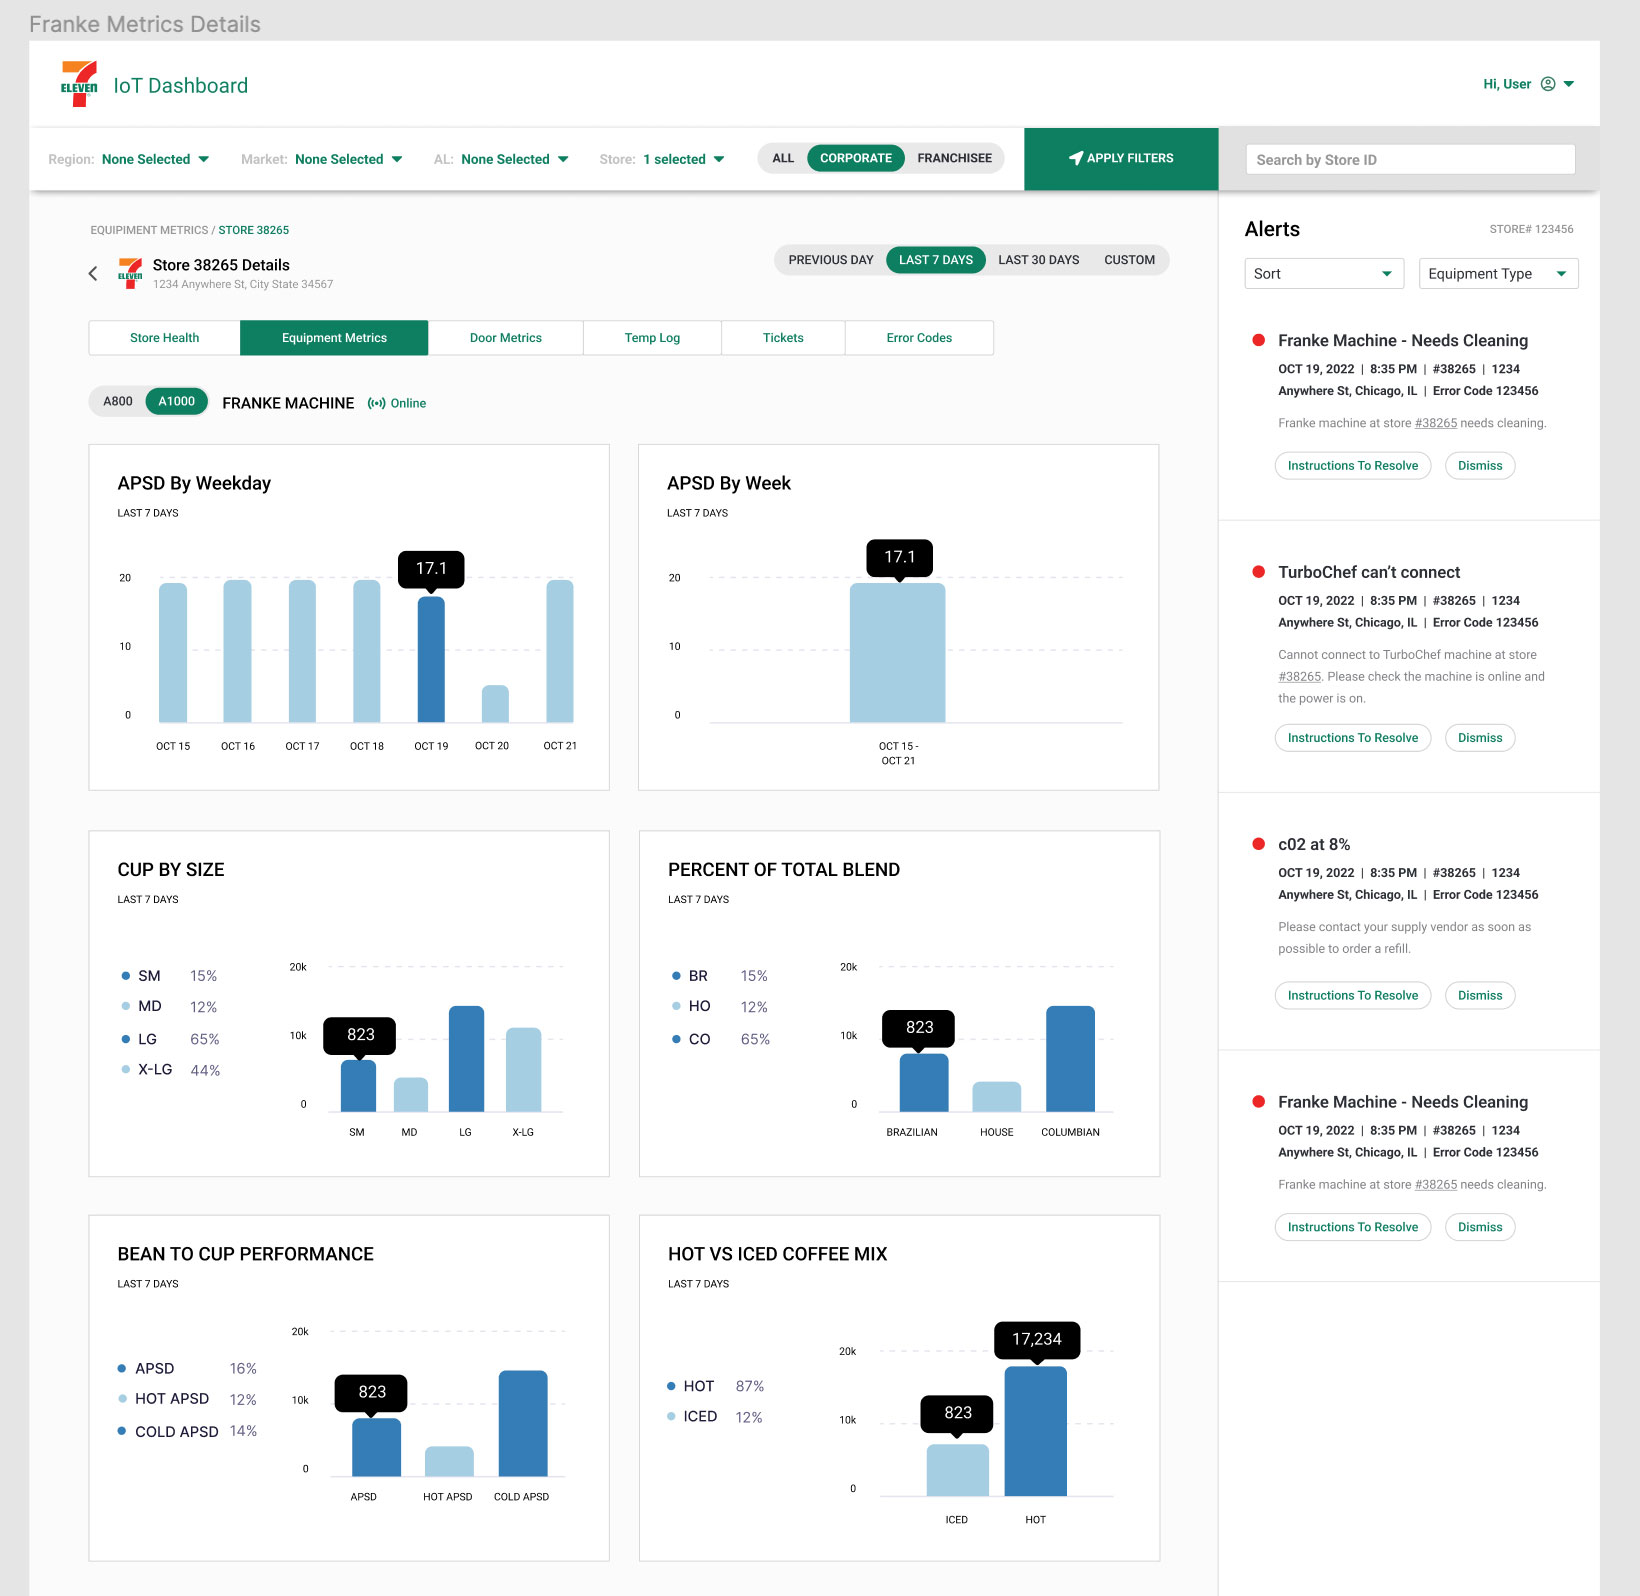
Each piece of monitored equipment was categorized and key insights were listed by priority. (By the way, if you are unfamiliar with it, a Franke machine is an expensive self-serve coffee machine used in all 7-11 stores.)
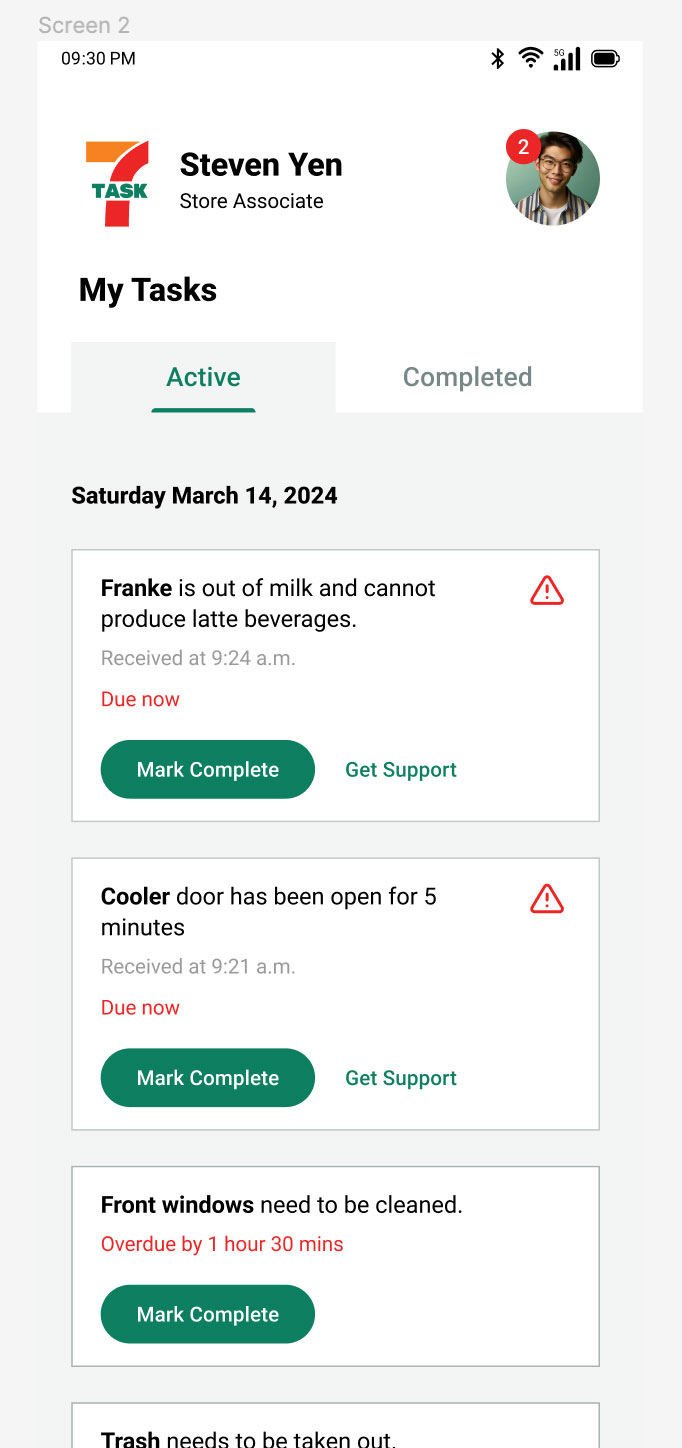
One of the most crucial aspects of running a successful business is having timely alerts that indicate potential problem areas. These alerts should not only provide a historical record of issues but also predict future problems. This helps to prevent significant monetary losses, such as spoilage of thousands of dollars worth of food due to a freezer malfunction. Or coffee sales being impacted by a machine being out of milk for hours.
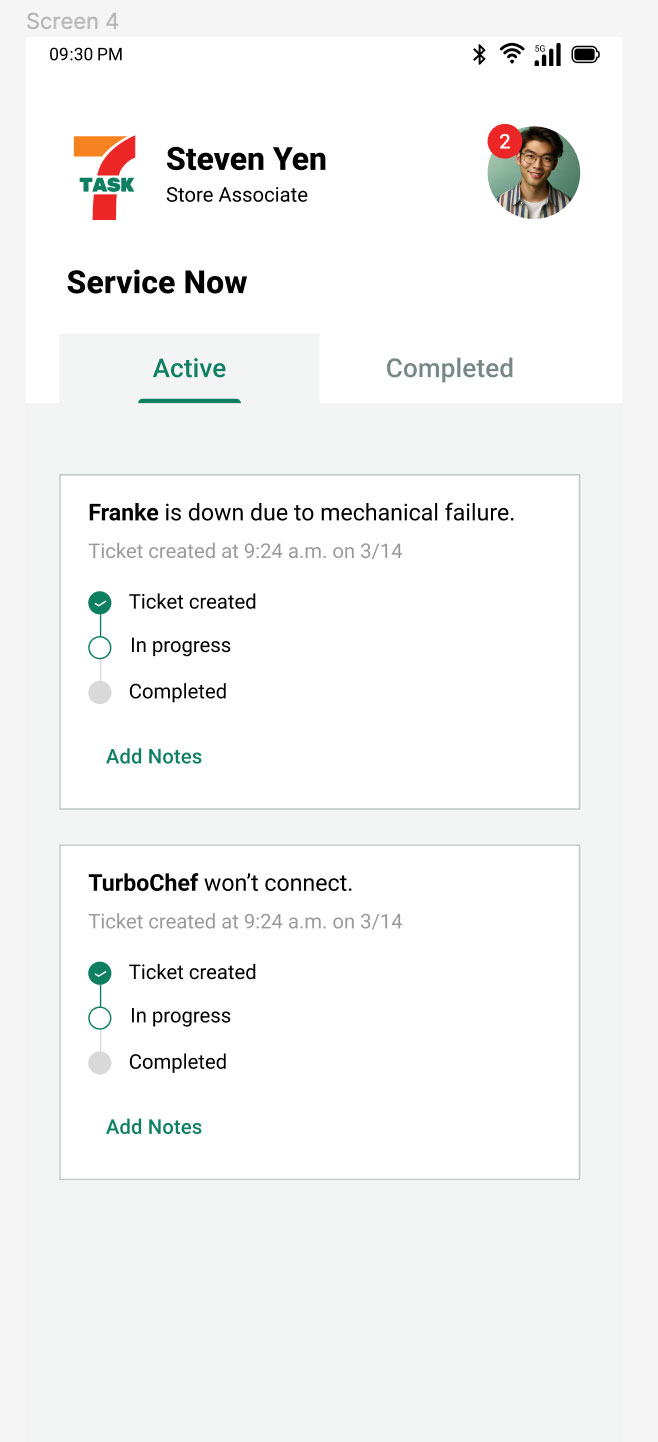
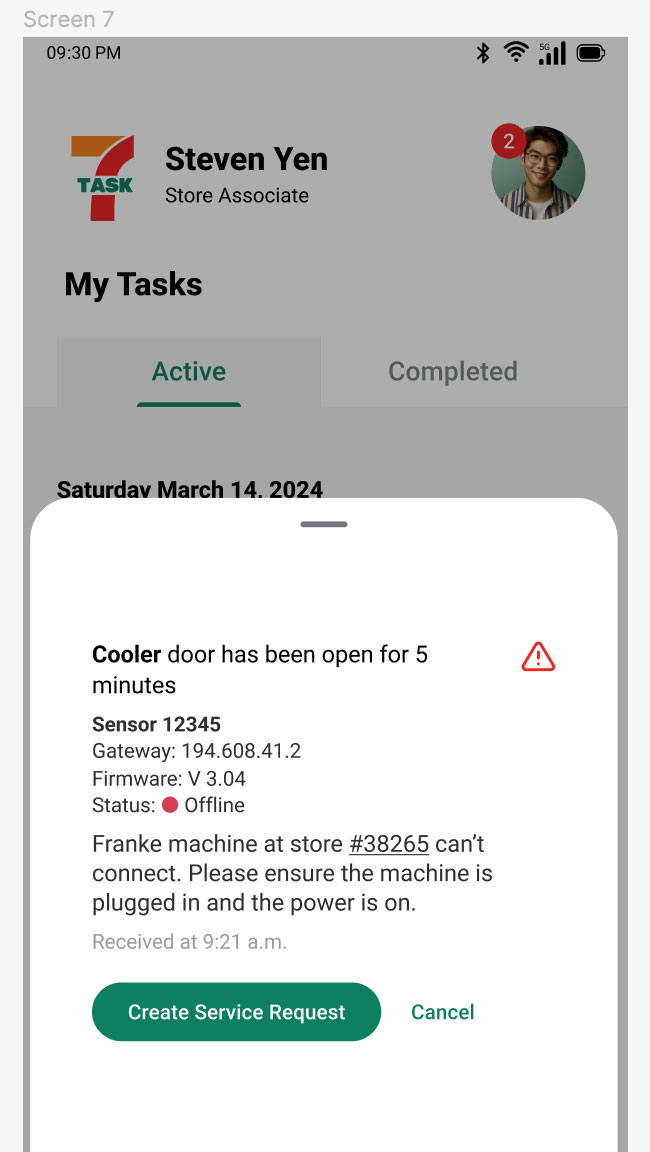
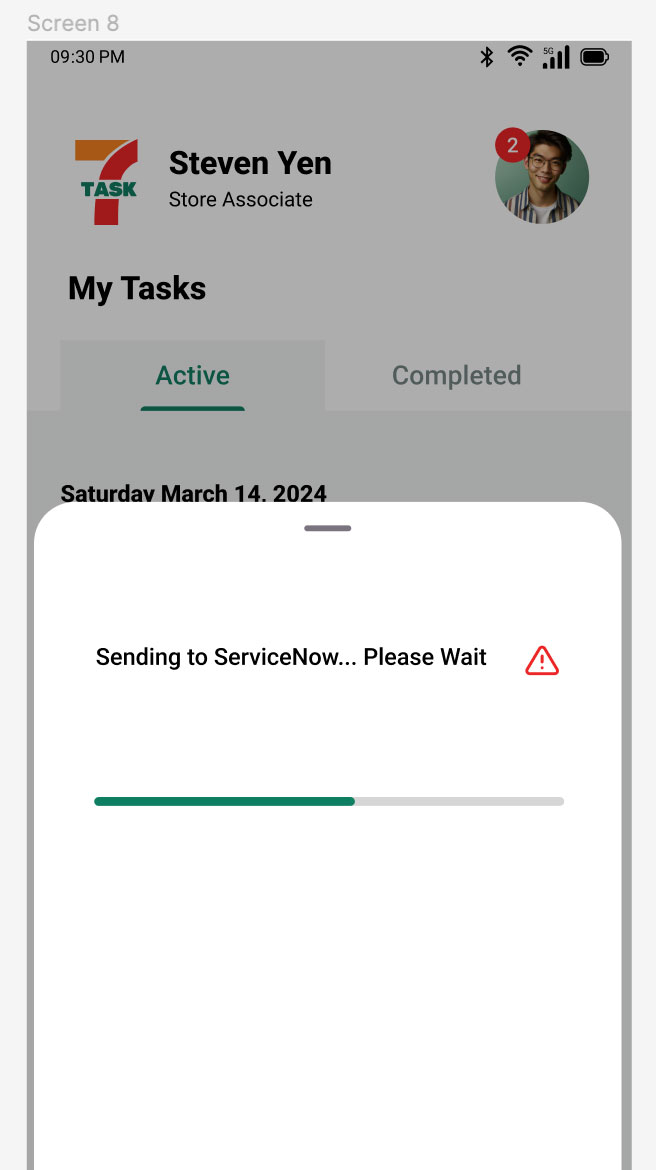
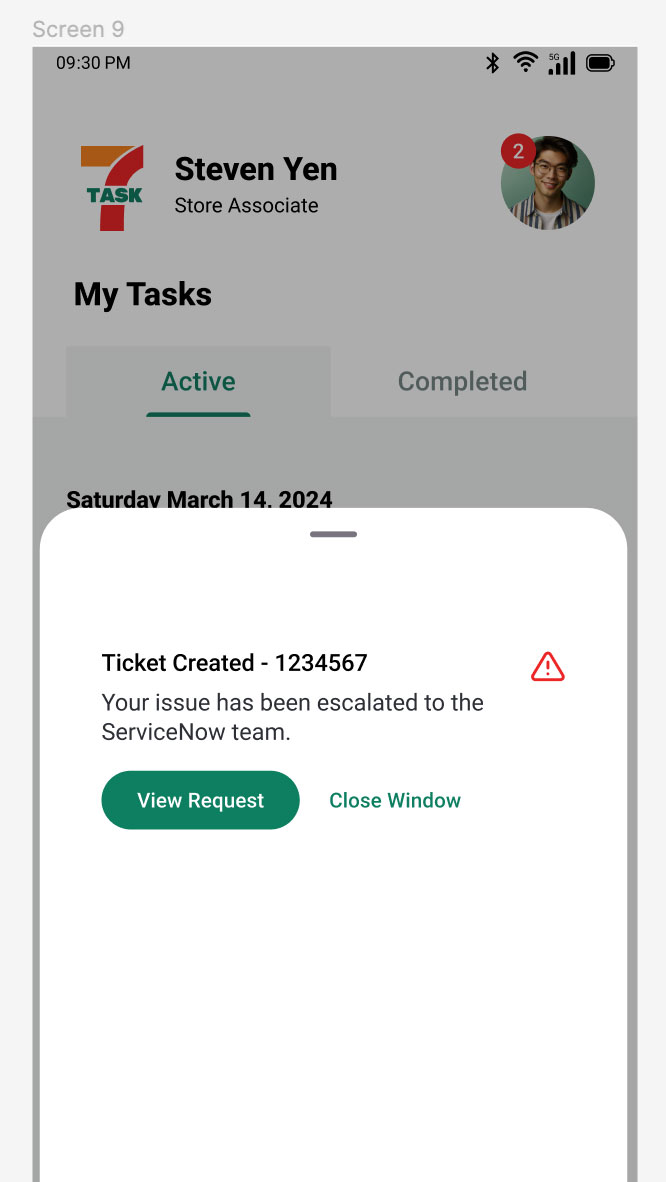
These alerts should be treated like dashboard alerts in a car, highlighting key areas where store associates or managers can take action. The store associate on duty can attempt to resolve the issue, or the manager can create a service ticket with just a few clicks, which will prompt a truck roll to investigate further. With this monitoring system, maintenance staff can be kept to a minimum and only focused on critical items, resulting in possible cost savings of hundreds of thousands of dollars per store.
Design
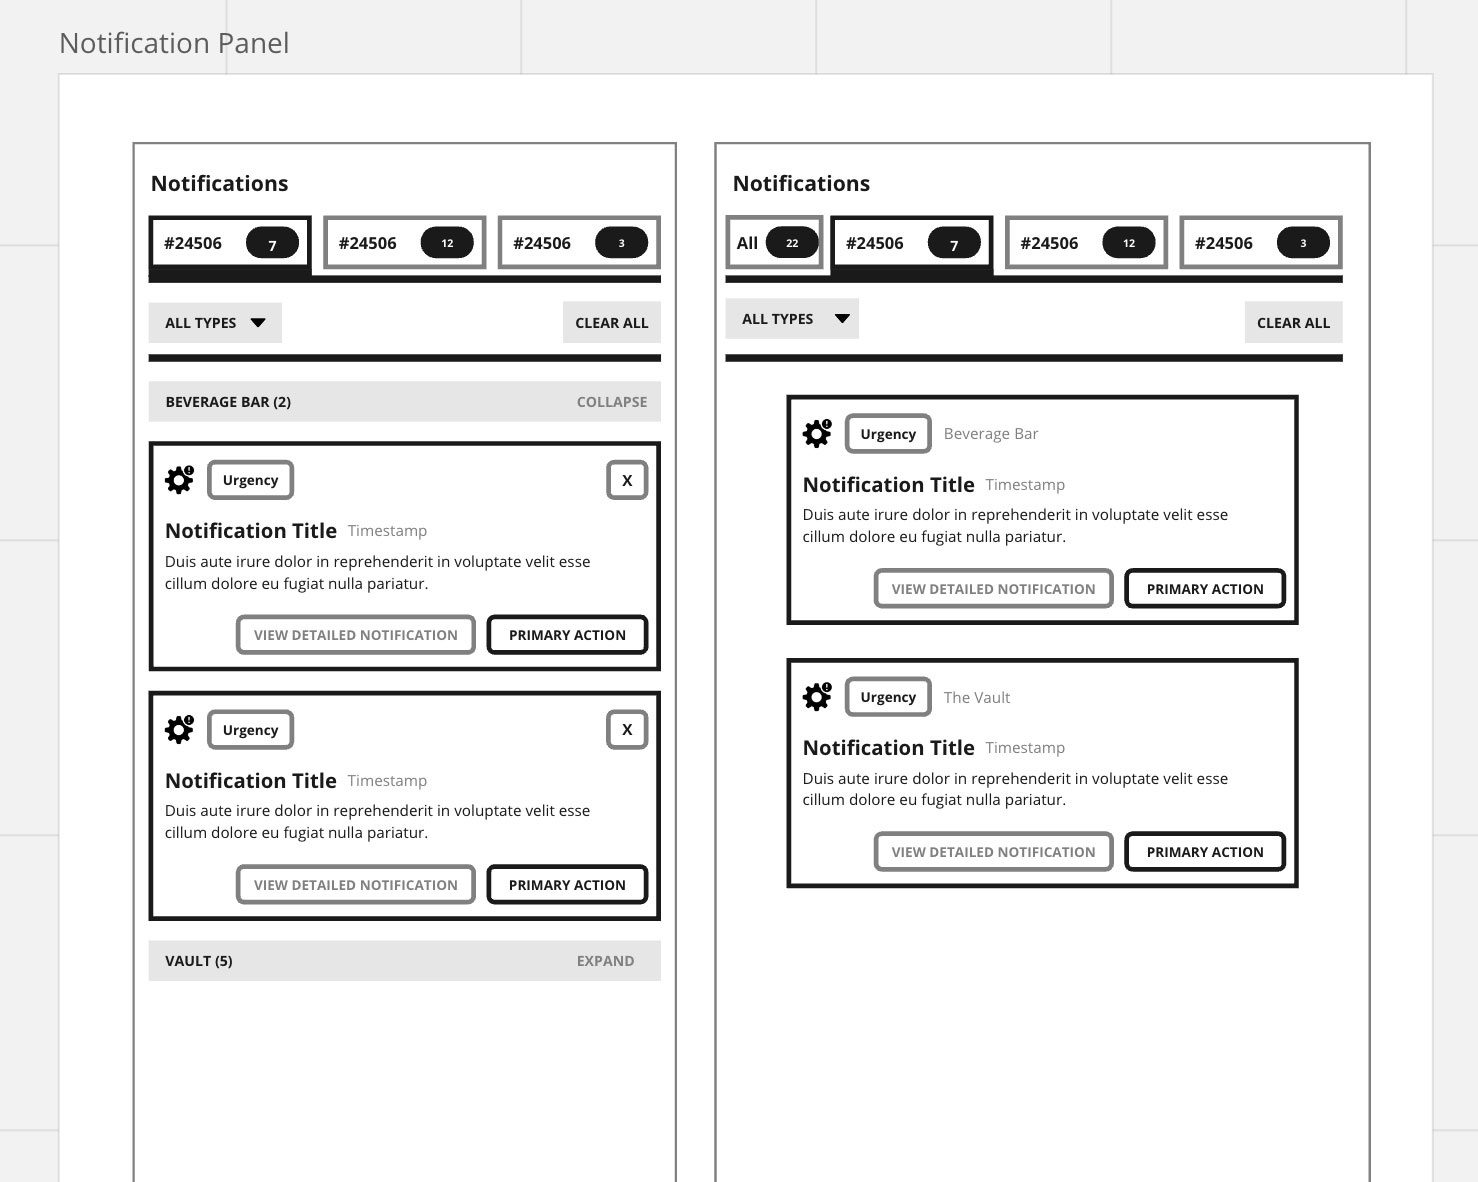
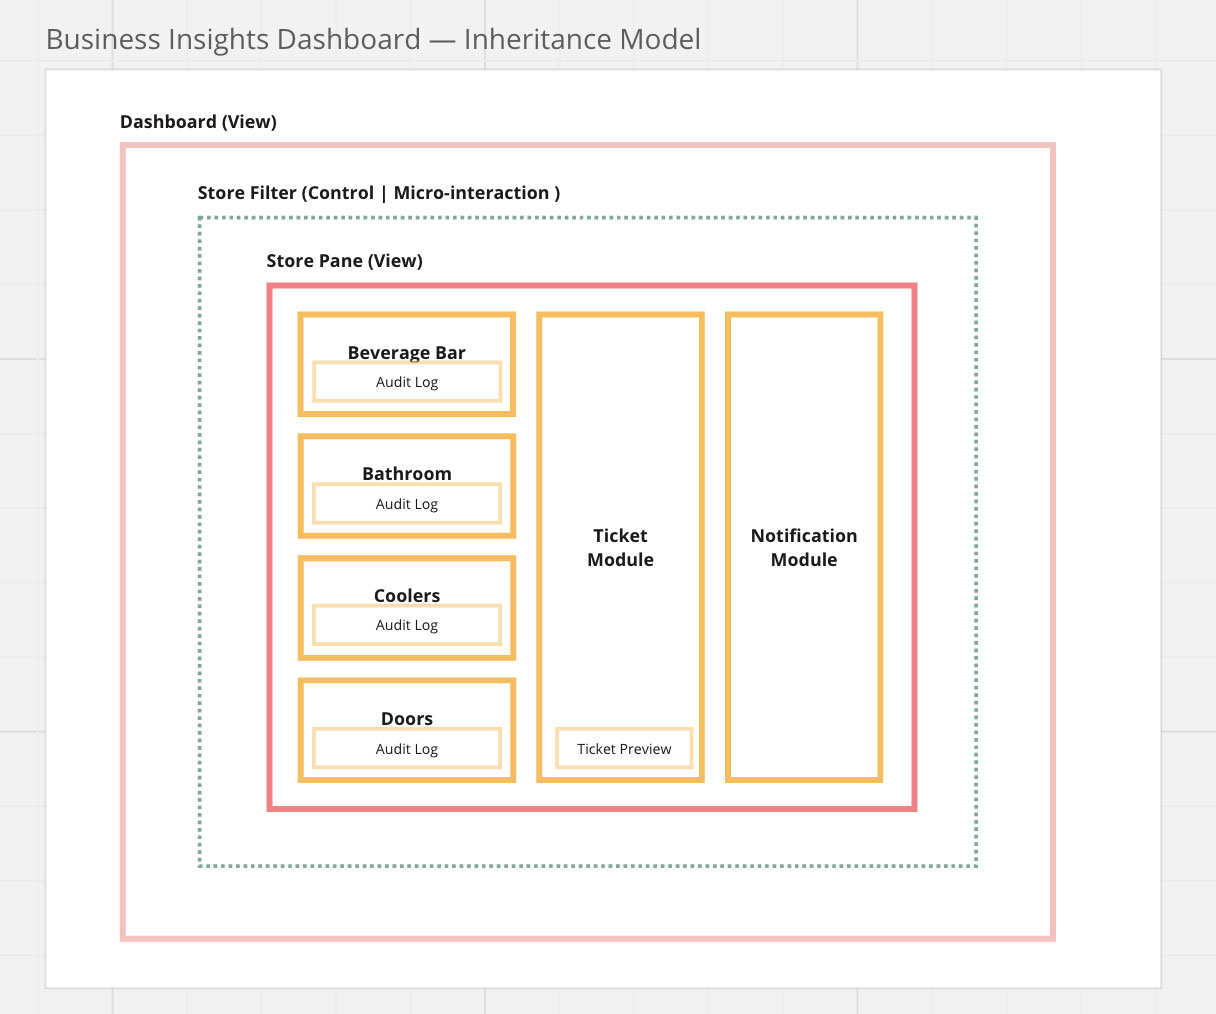
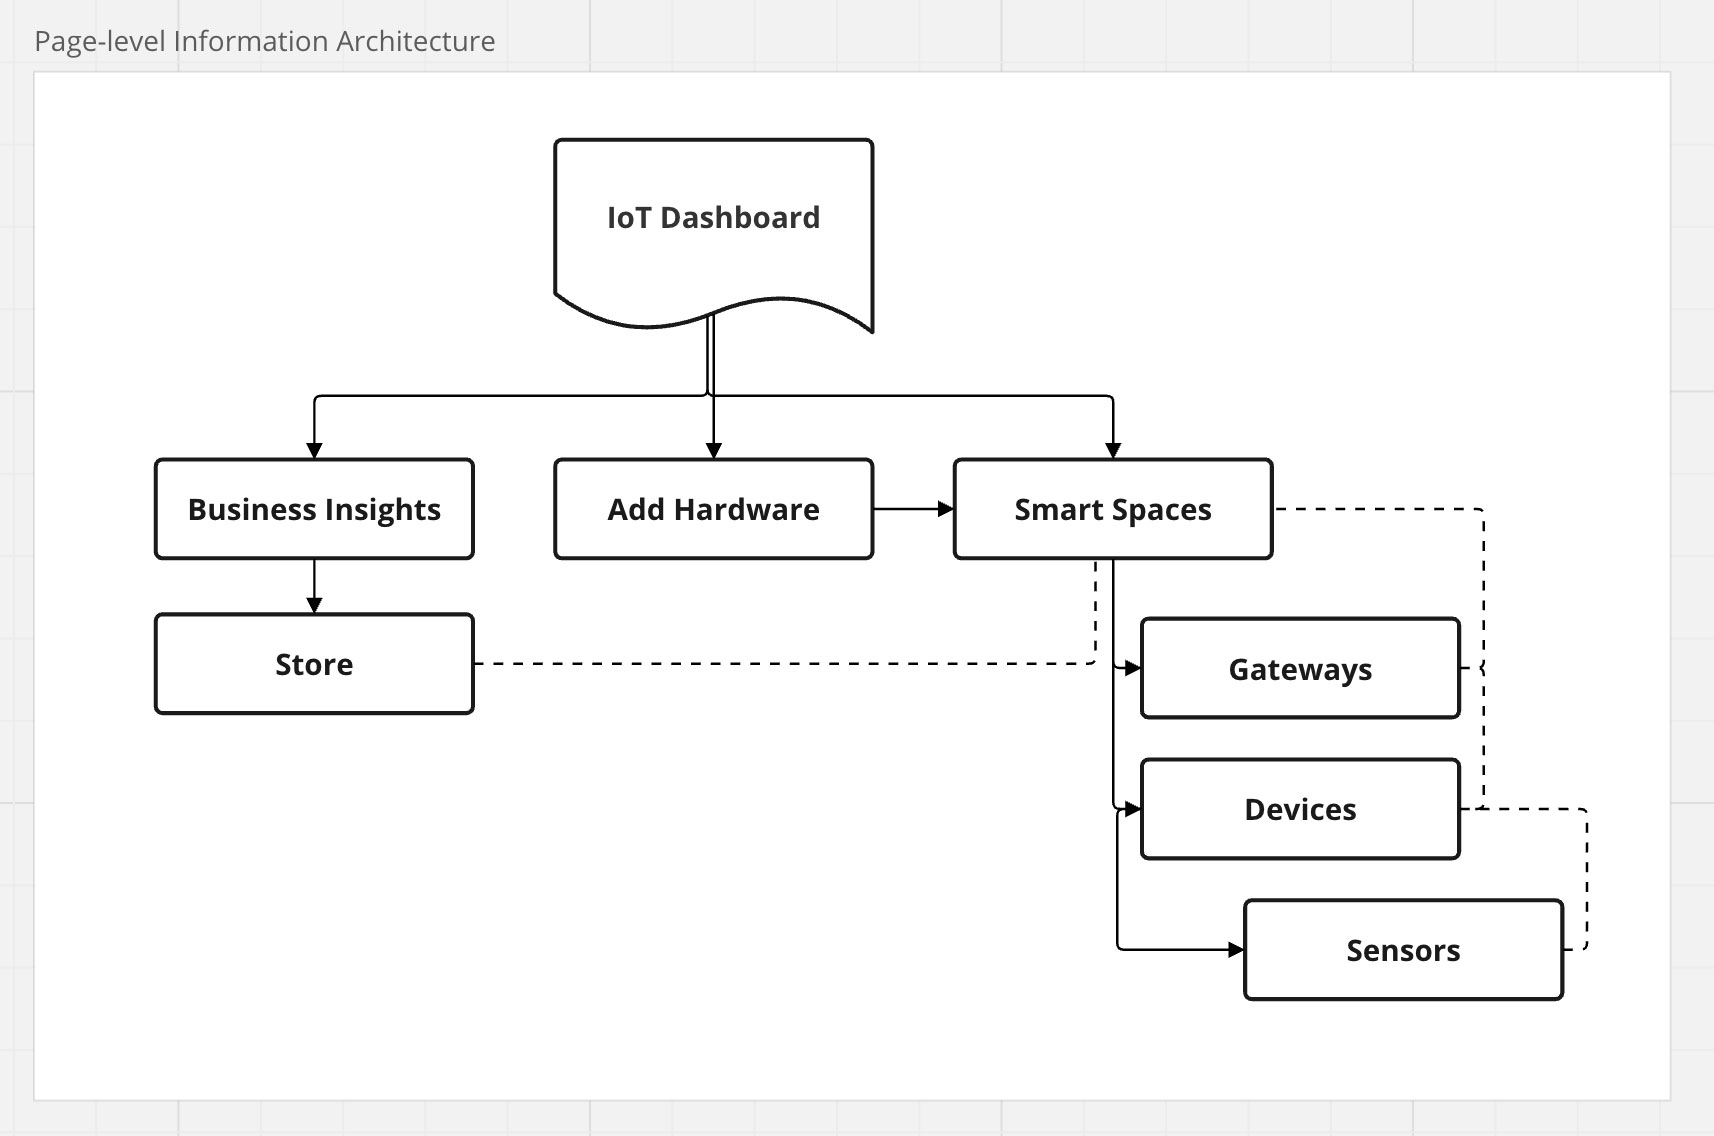
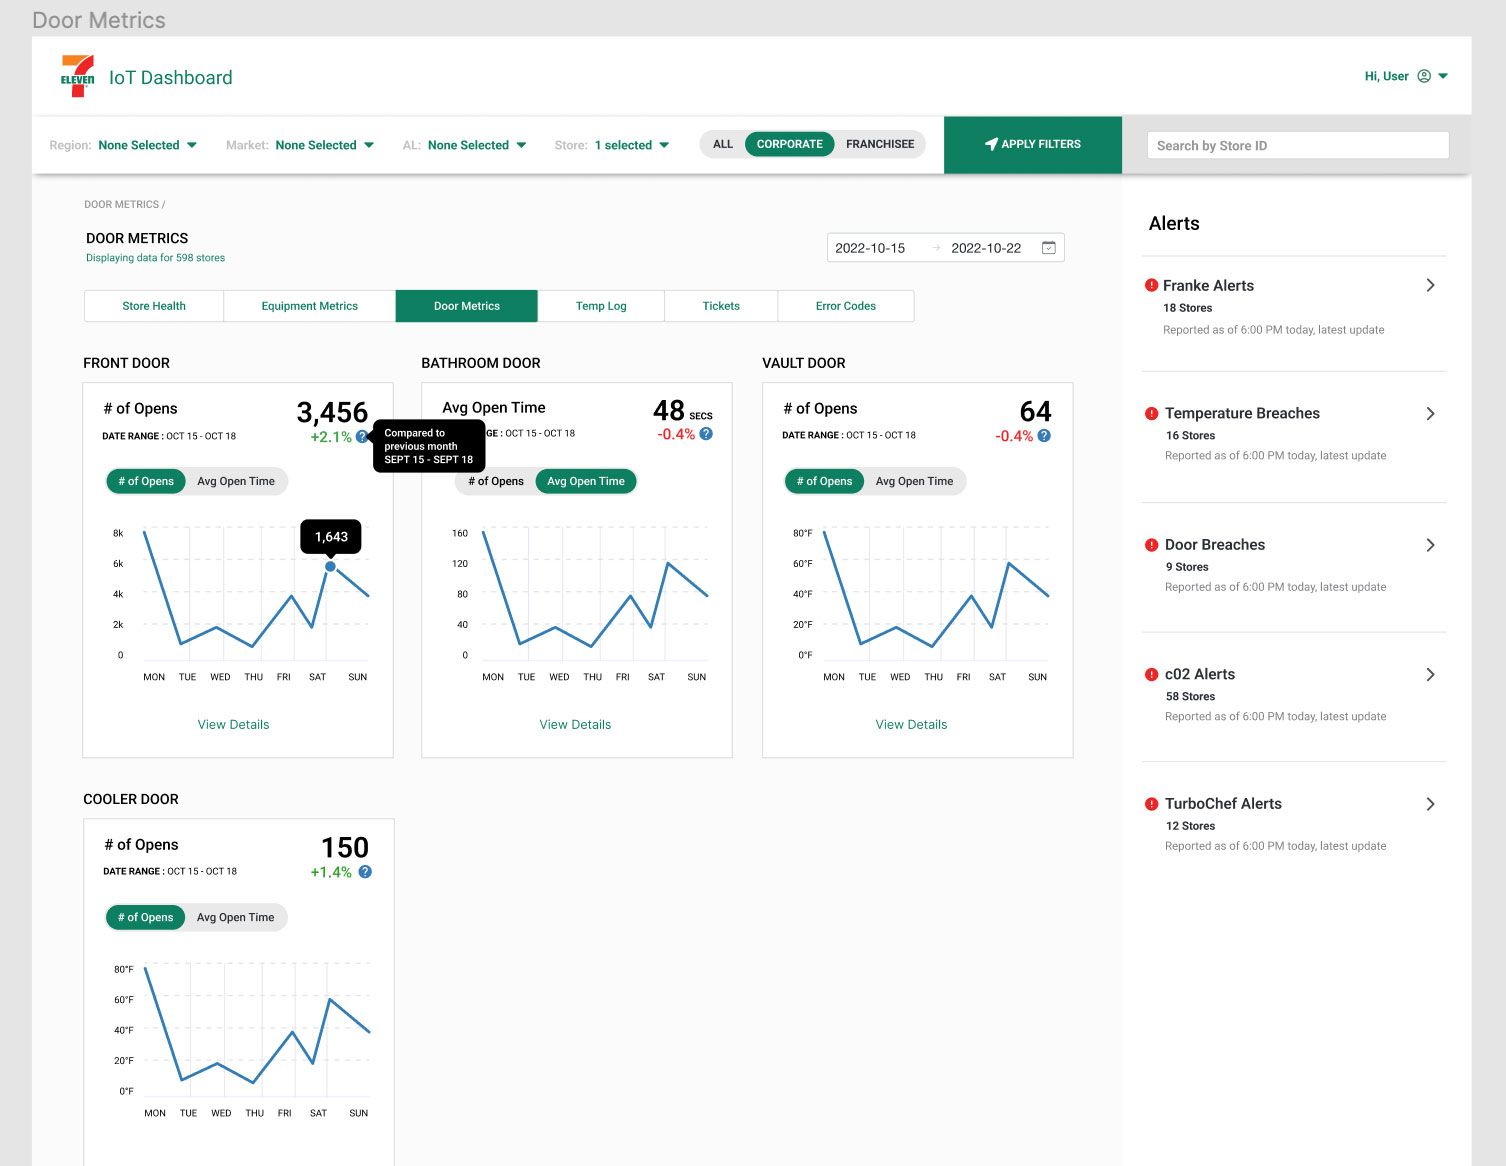
The design of the dashboard first started with wireframes estavblishing user flows, organization of information and ensuring proper data appears on screen.
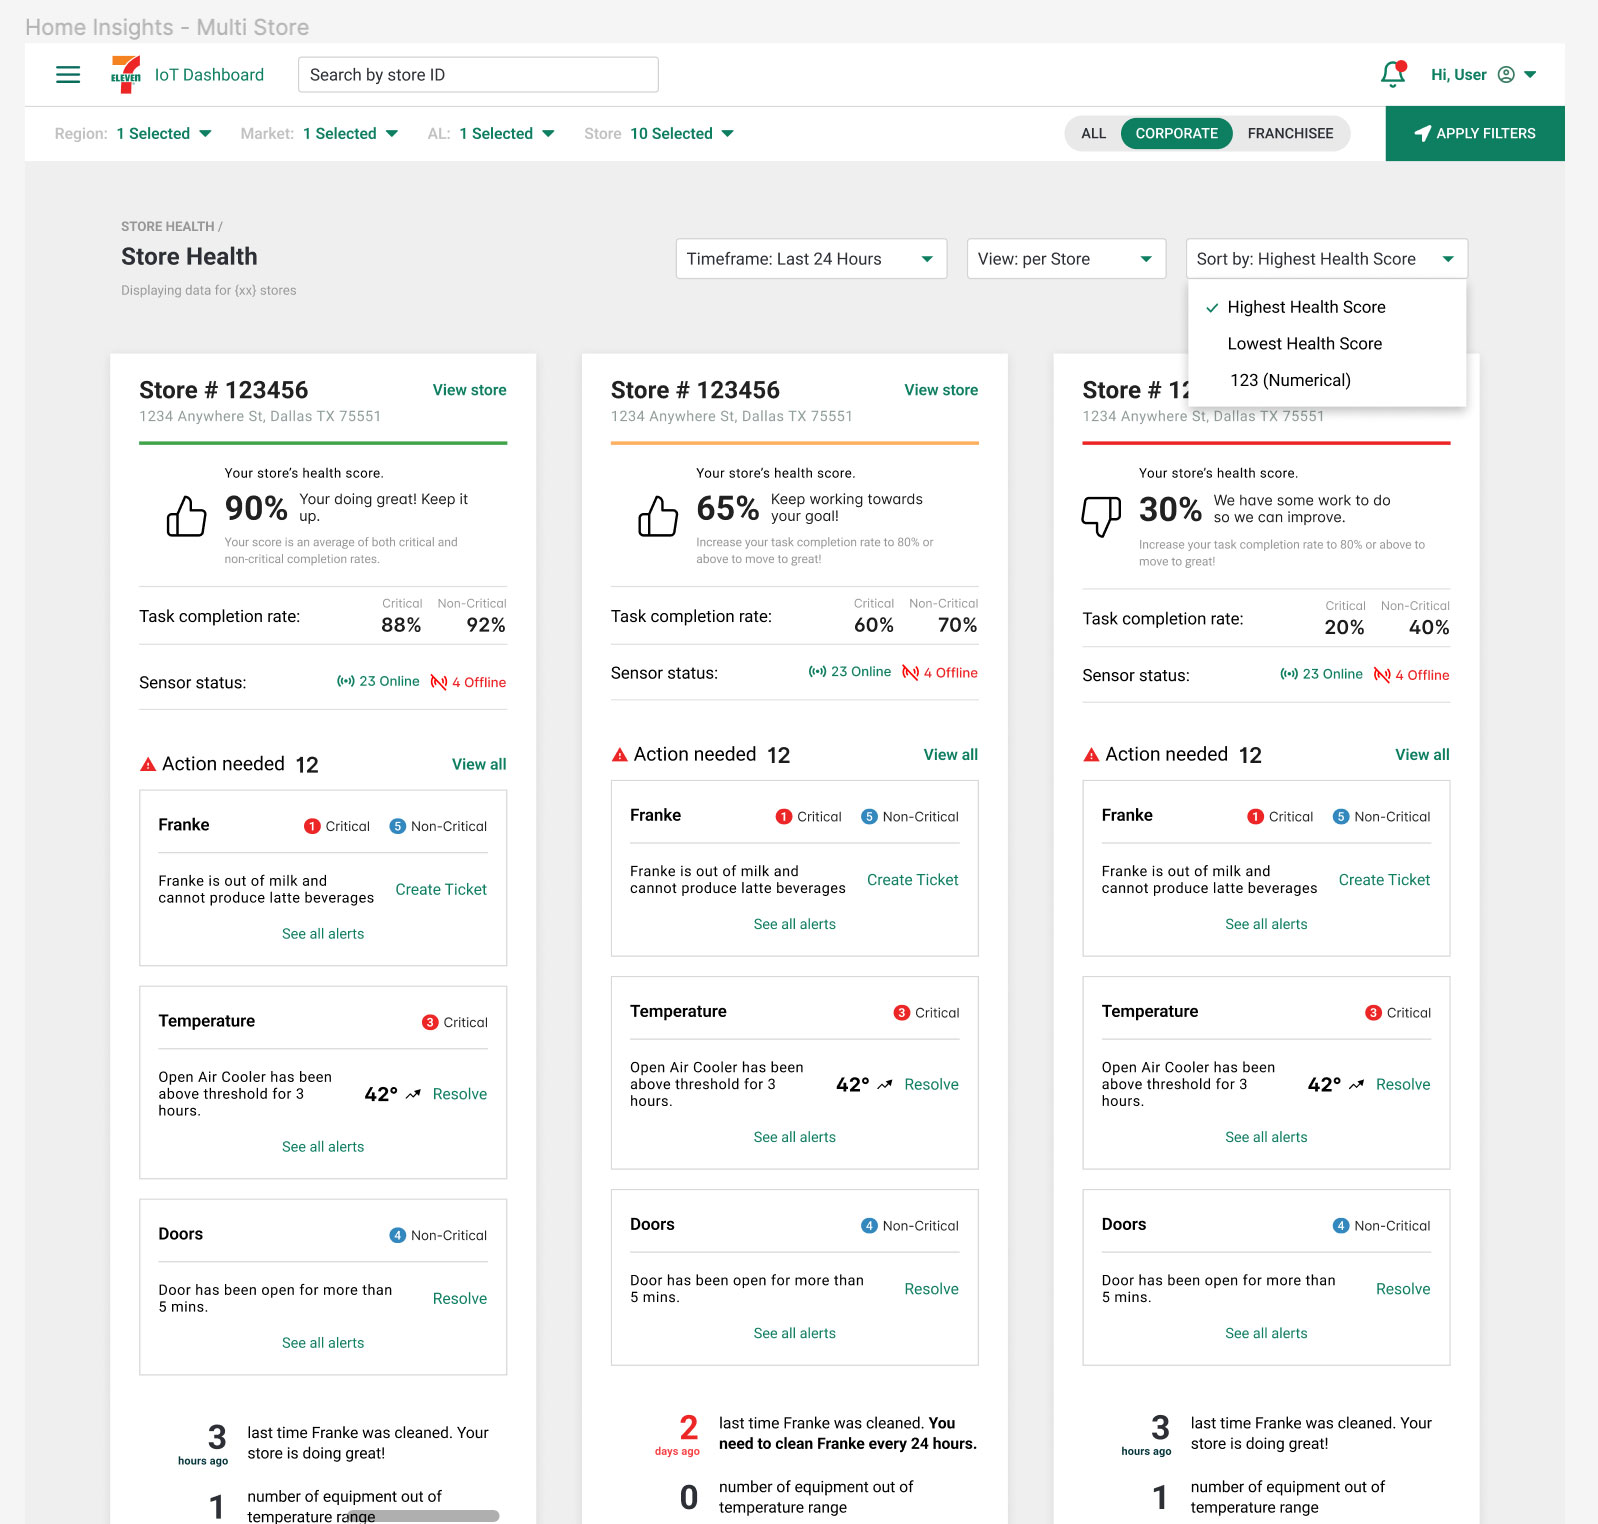
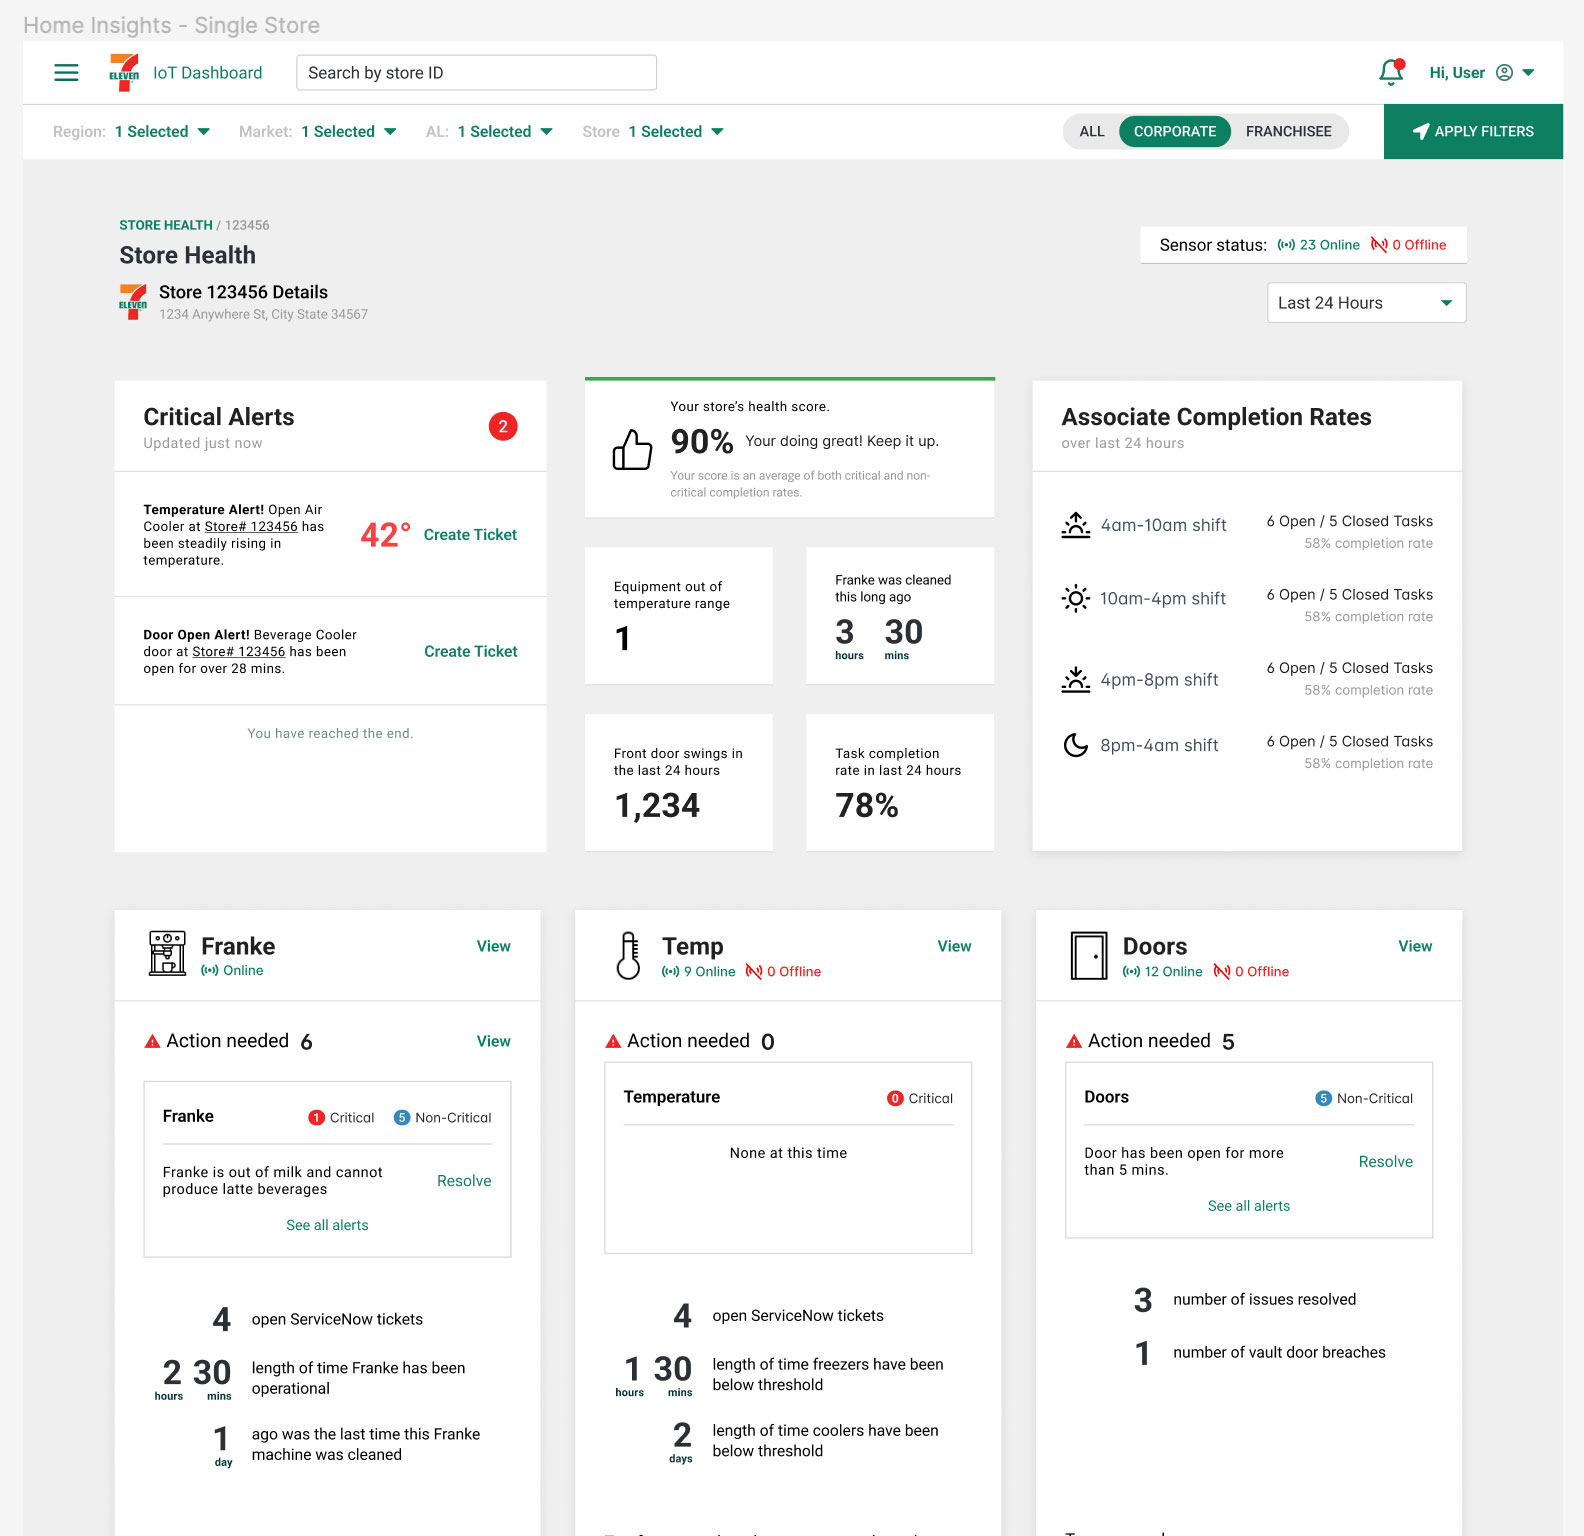
A set of screens were created with a focus on displaying alerts that were always available for the users to take action no matter where they were in the application. These alerts had to be shown depending on the user's persona, either for single stores or multiple stores at once. Some users managed several stores in a day and needed to access their most critical tasks in a single view.
Some first draft designs:
Testing
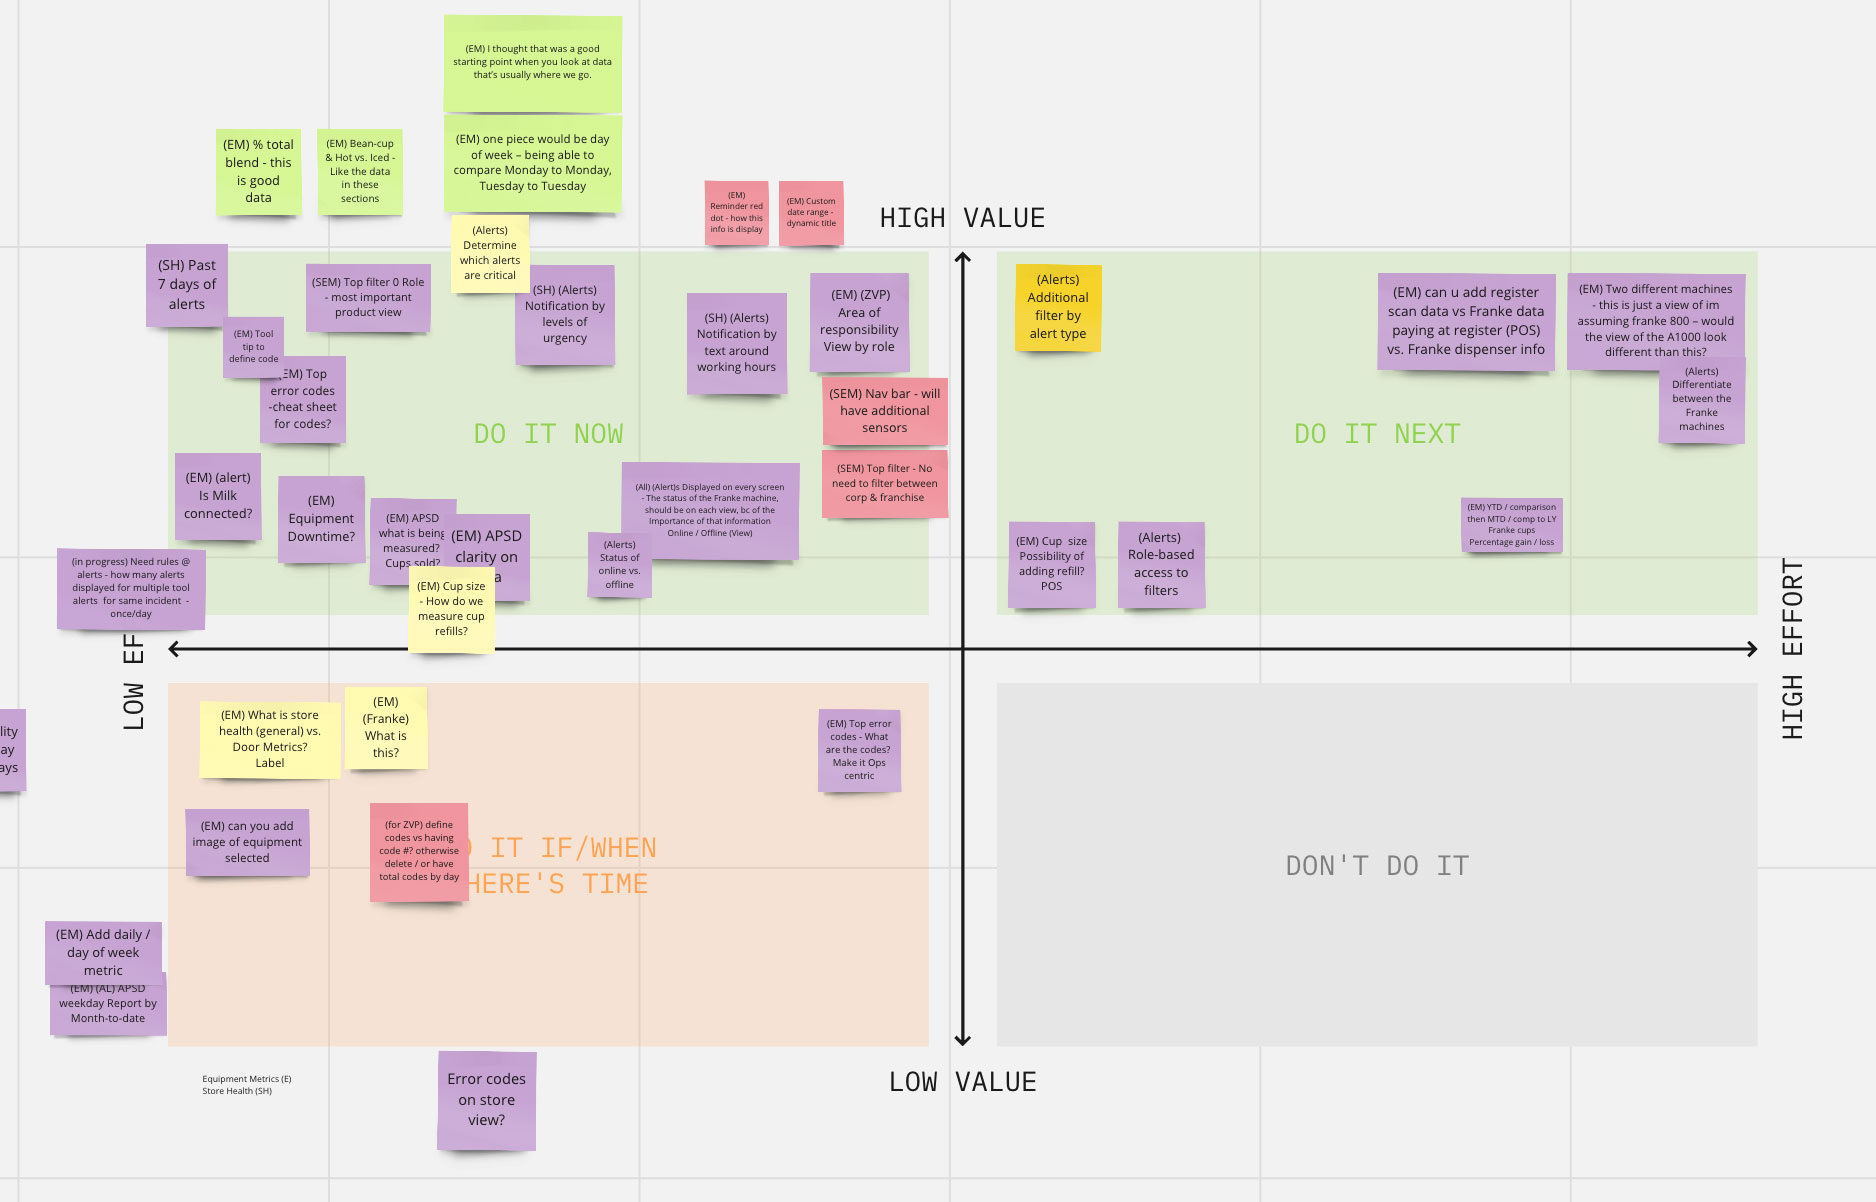
Testing has begun to review the draft designs with users. I conducted a set of similar moderated phone interviews to discuss the priority of data insights, alert actions, and other feedback. This resulted in a variety of ideas that were then prioritized, and changes were made before the sprint work started with development.
Deliverables
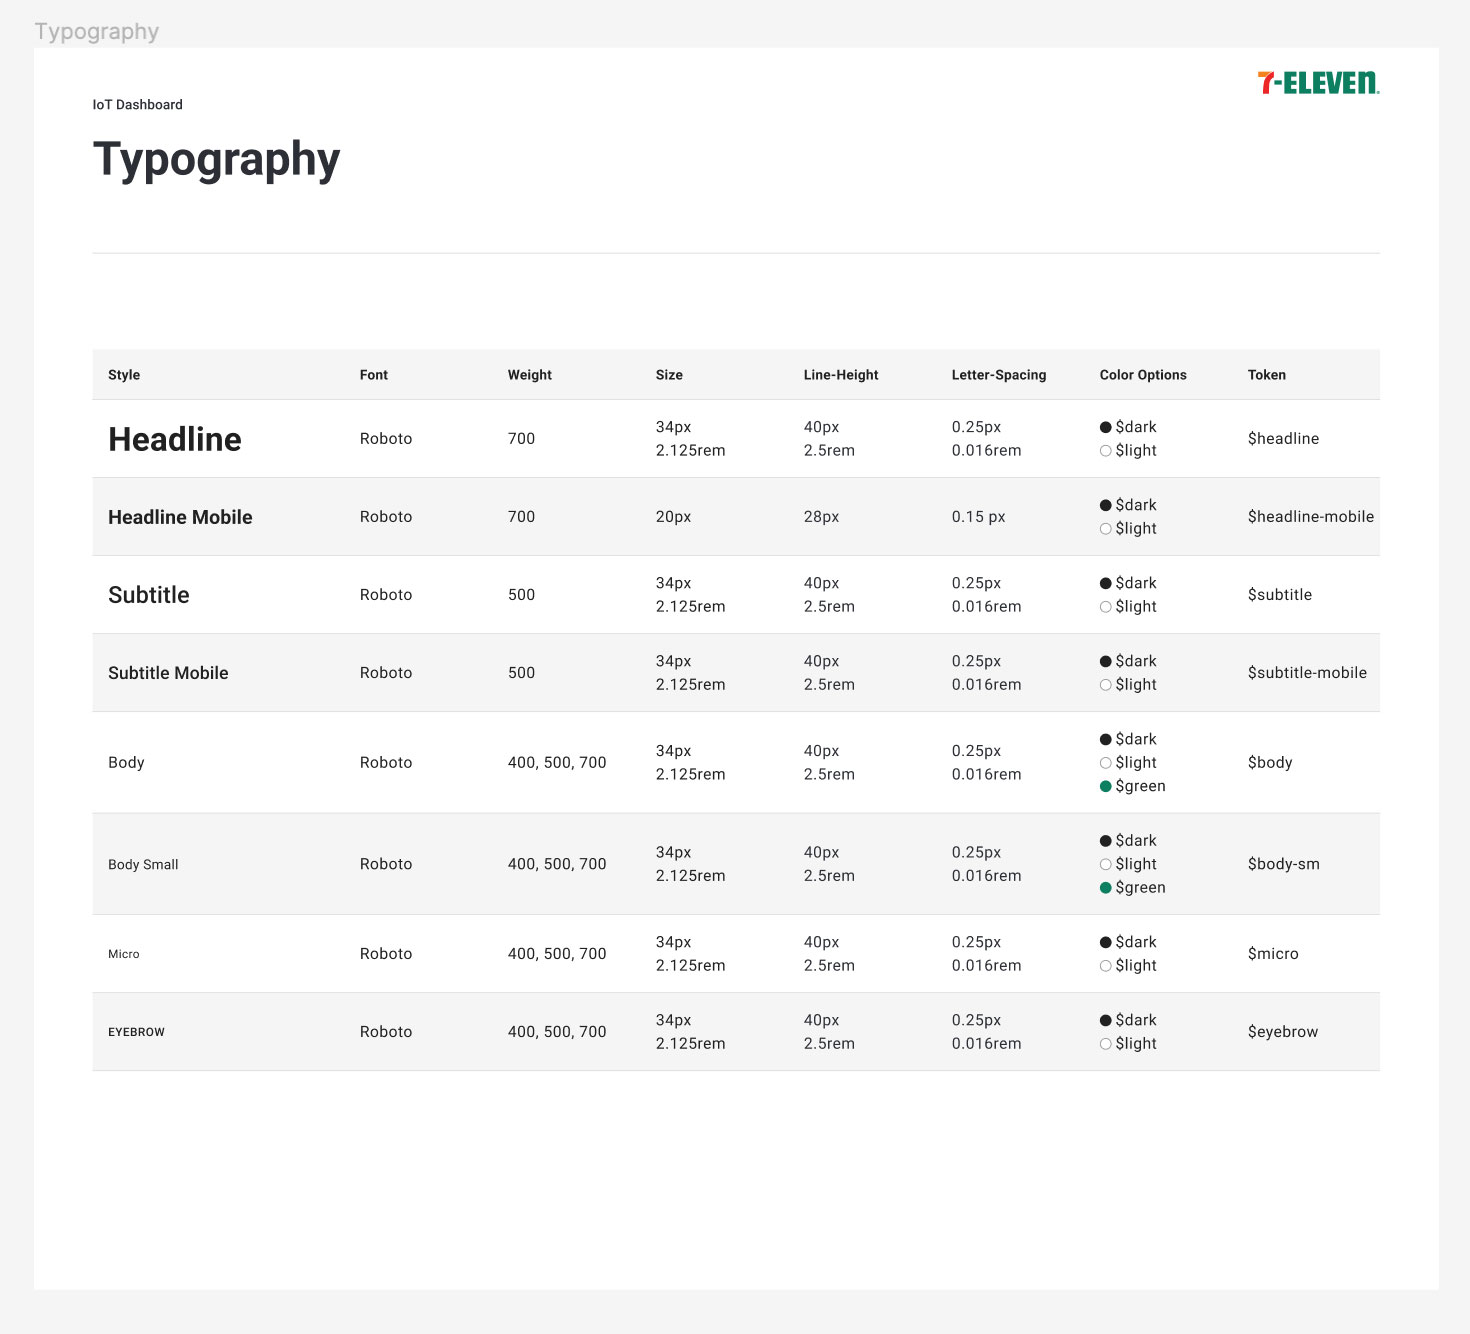
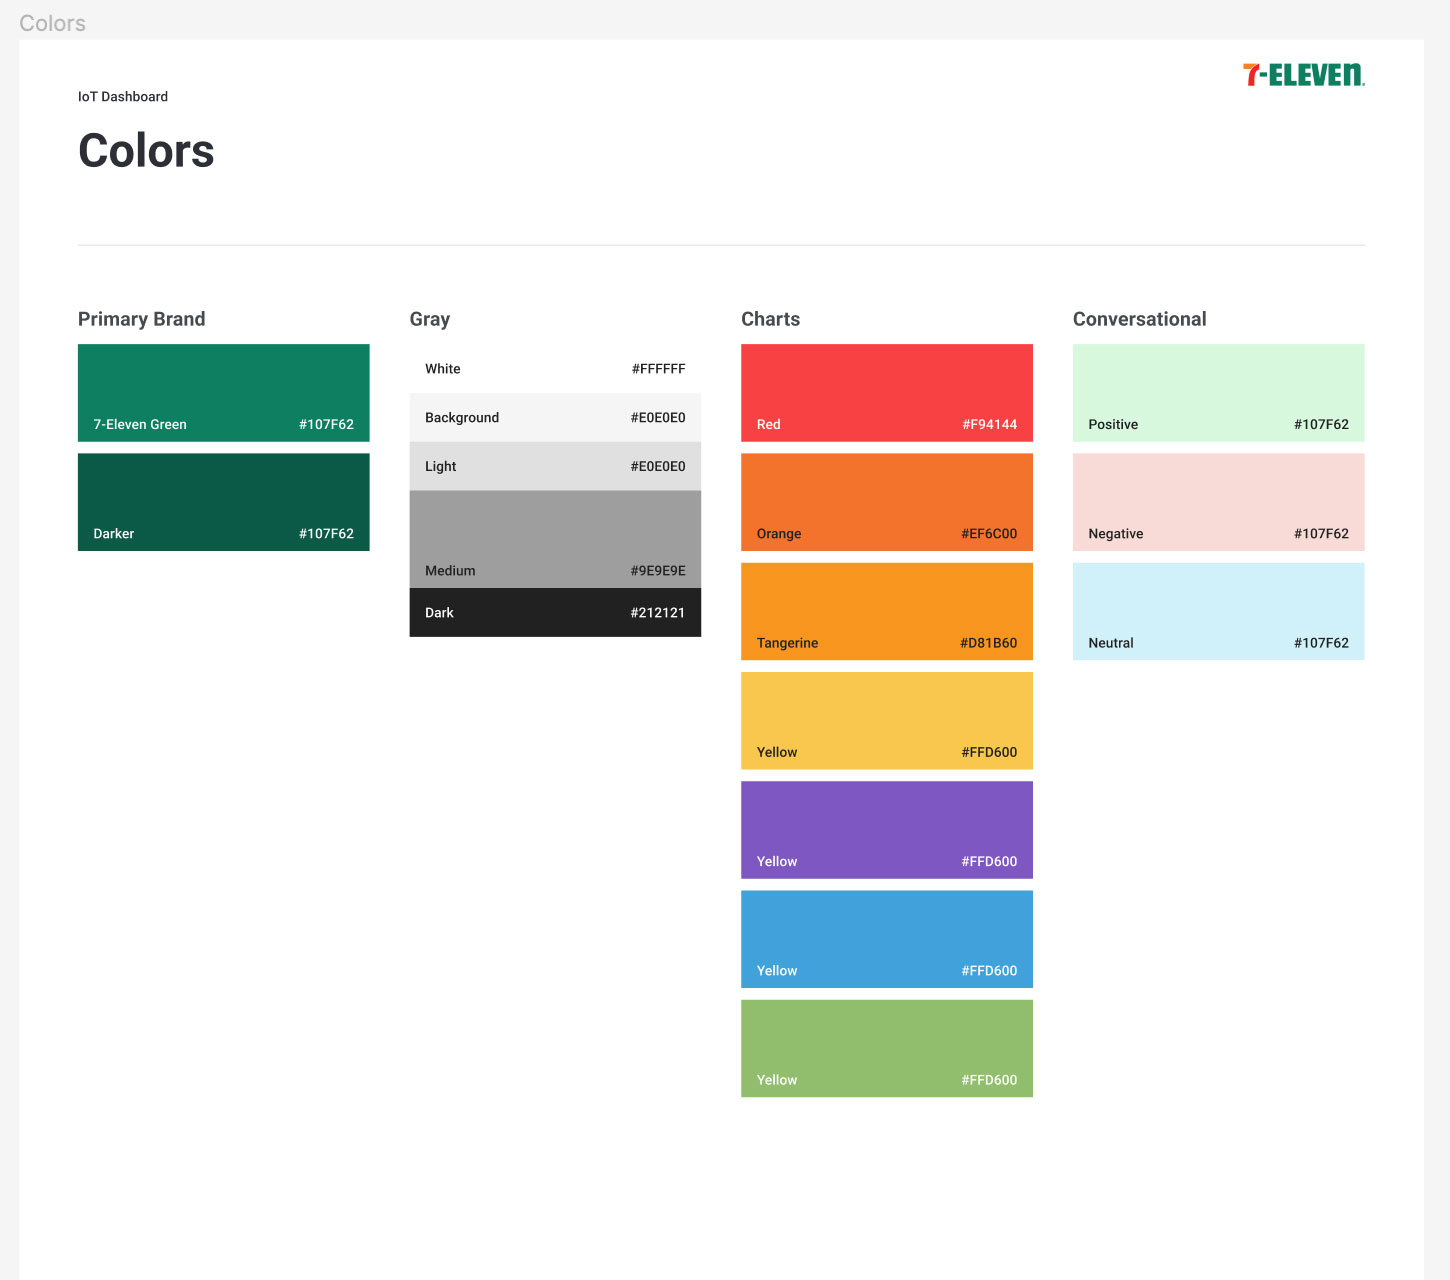
Initial draft deliverables with components was worked on with development partners in an agile sprint based implementation process.
Evolution
Product design is an iterative process where nothing is ever set in stone. We learn something new every day from our users, which helps us refine our ideas and add new features. After coding these designs, we roll them out to our users. Through testing, we've identified key changes that need to be made and continue to evolve our designs based on user feedback.
- During their shifts, provide an Android app for mobile devices to be used by associates.
- Alert managers via text message and on Android app for critical alerts.
- To detect faulty equipment, it is recommended to monitor the recurring error codes and the overall behavior of uptime.
- Categorize stores based on critical and non-critical task completion rates, and grade their health accordingly.
Desktop Web Product
Associate Android App